iOS trading journal
← Trading terms glossary

What Is Calmar Ratio?

The Calmar ratio is a performance metric that compares a trading strategy's average annual return to its maximum drawdown (the largest peak-to-trough loss). It answers the question: how much profit per unit of risk did the strategy produce? Traders pay attention to it because it rewards consistent returns while penalizing large losses, making it useful for comparing strategies that take different amounts of risk.

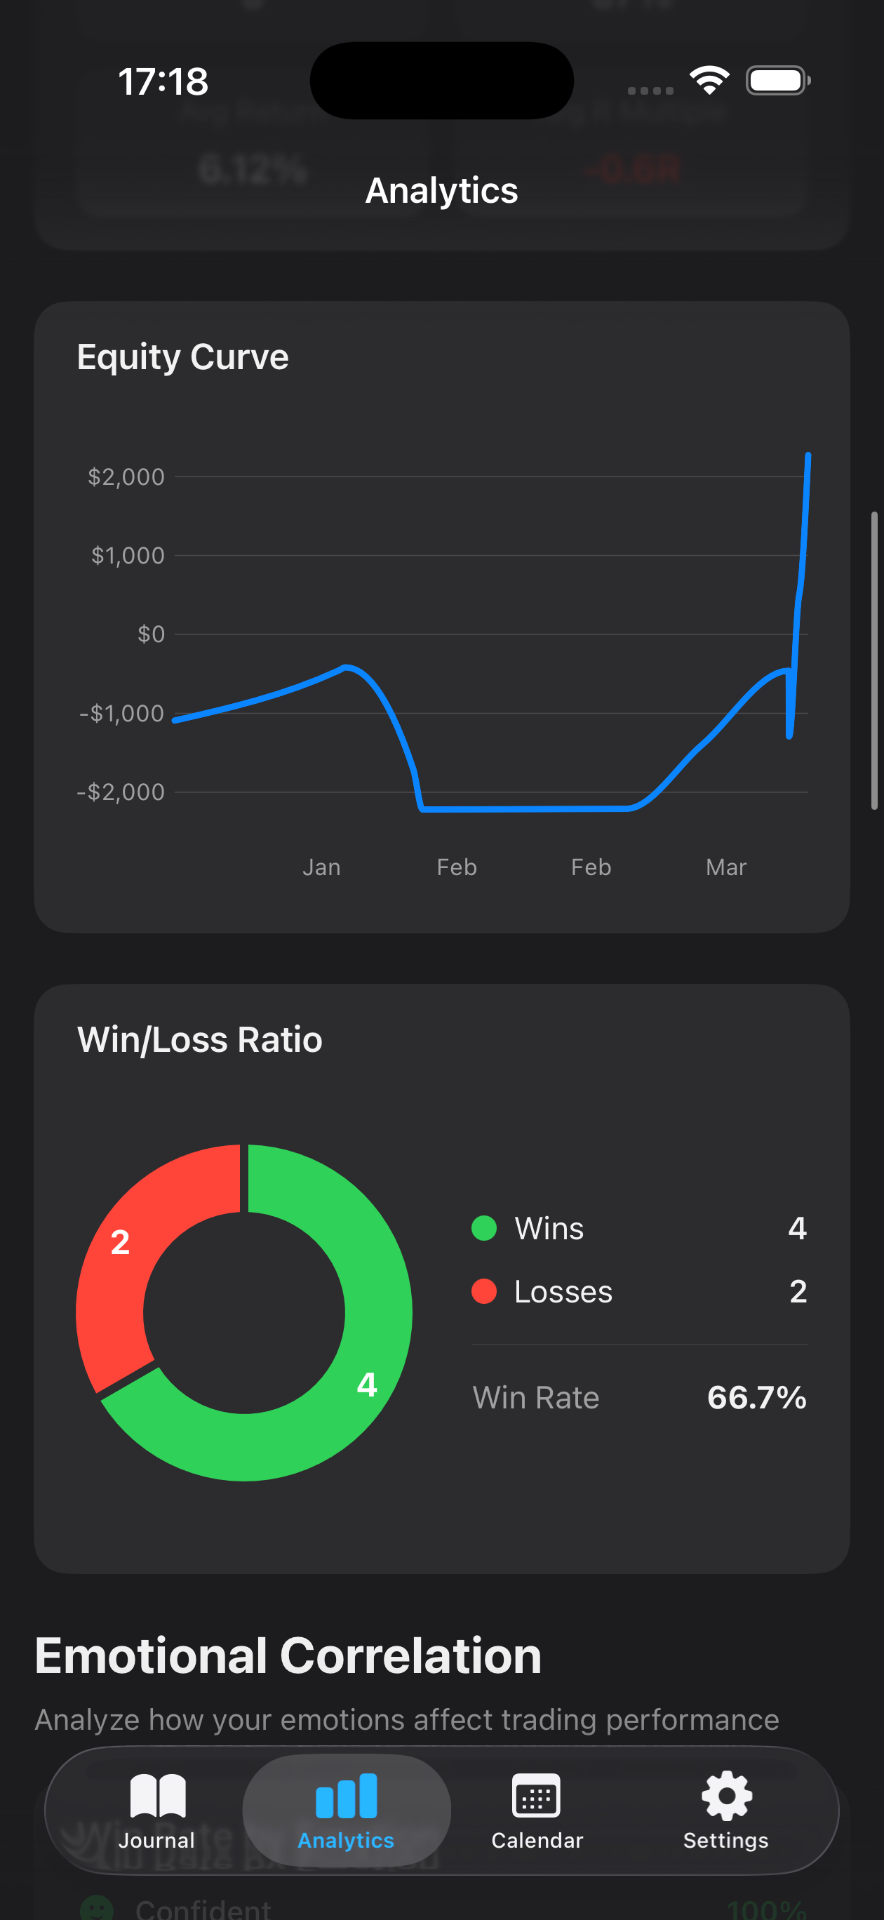
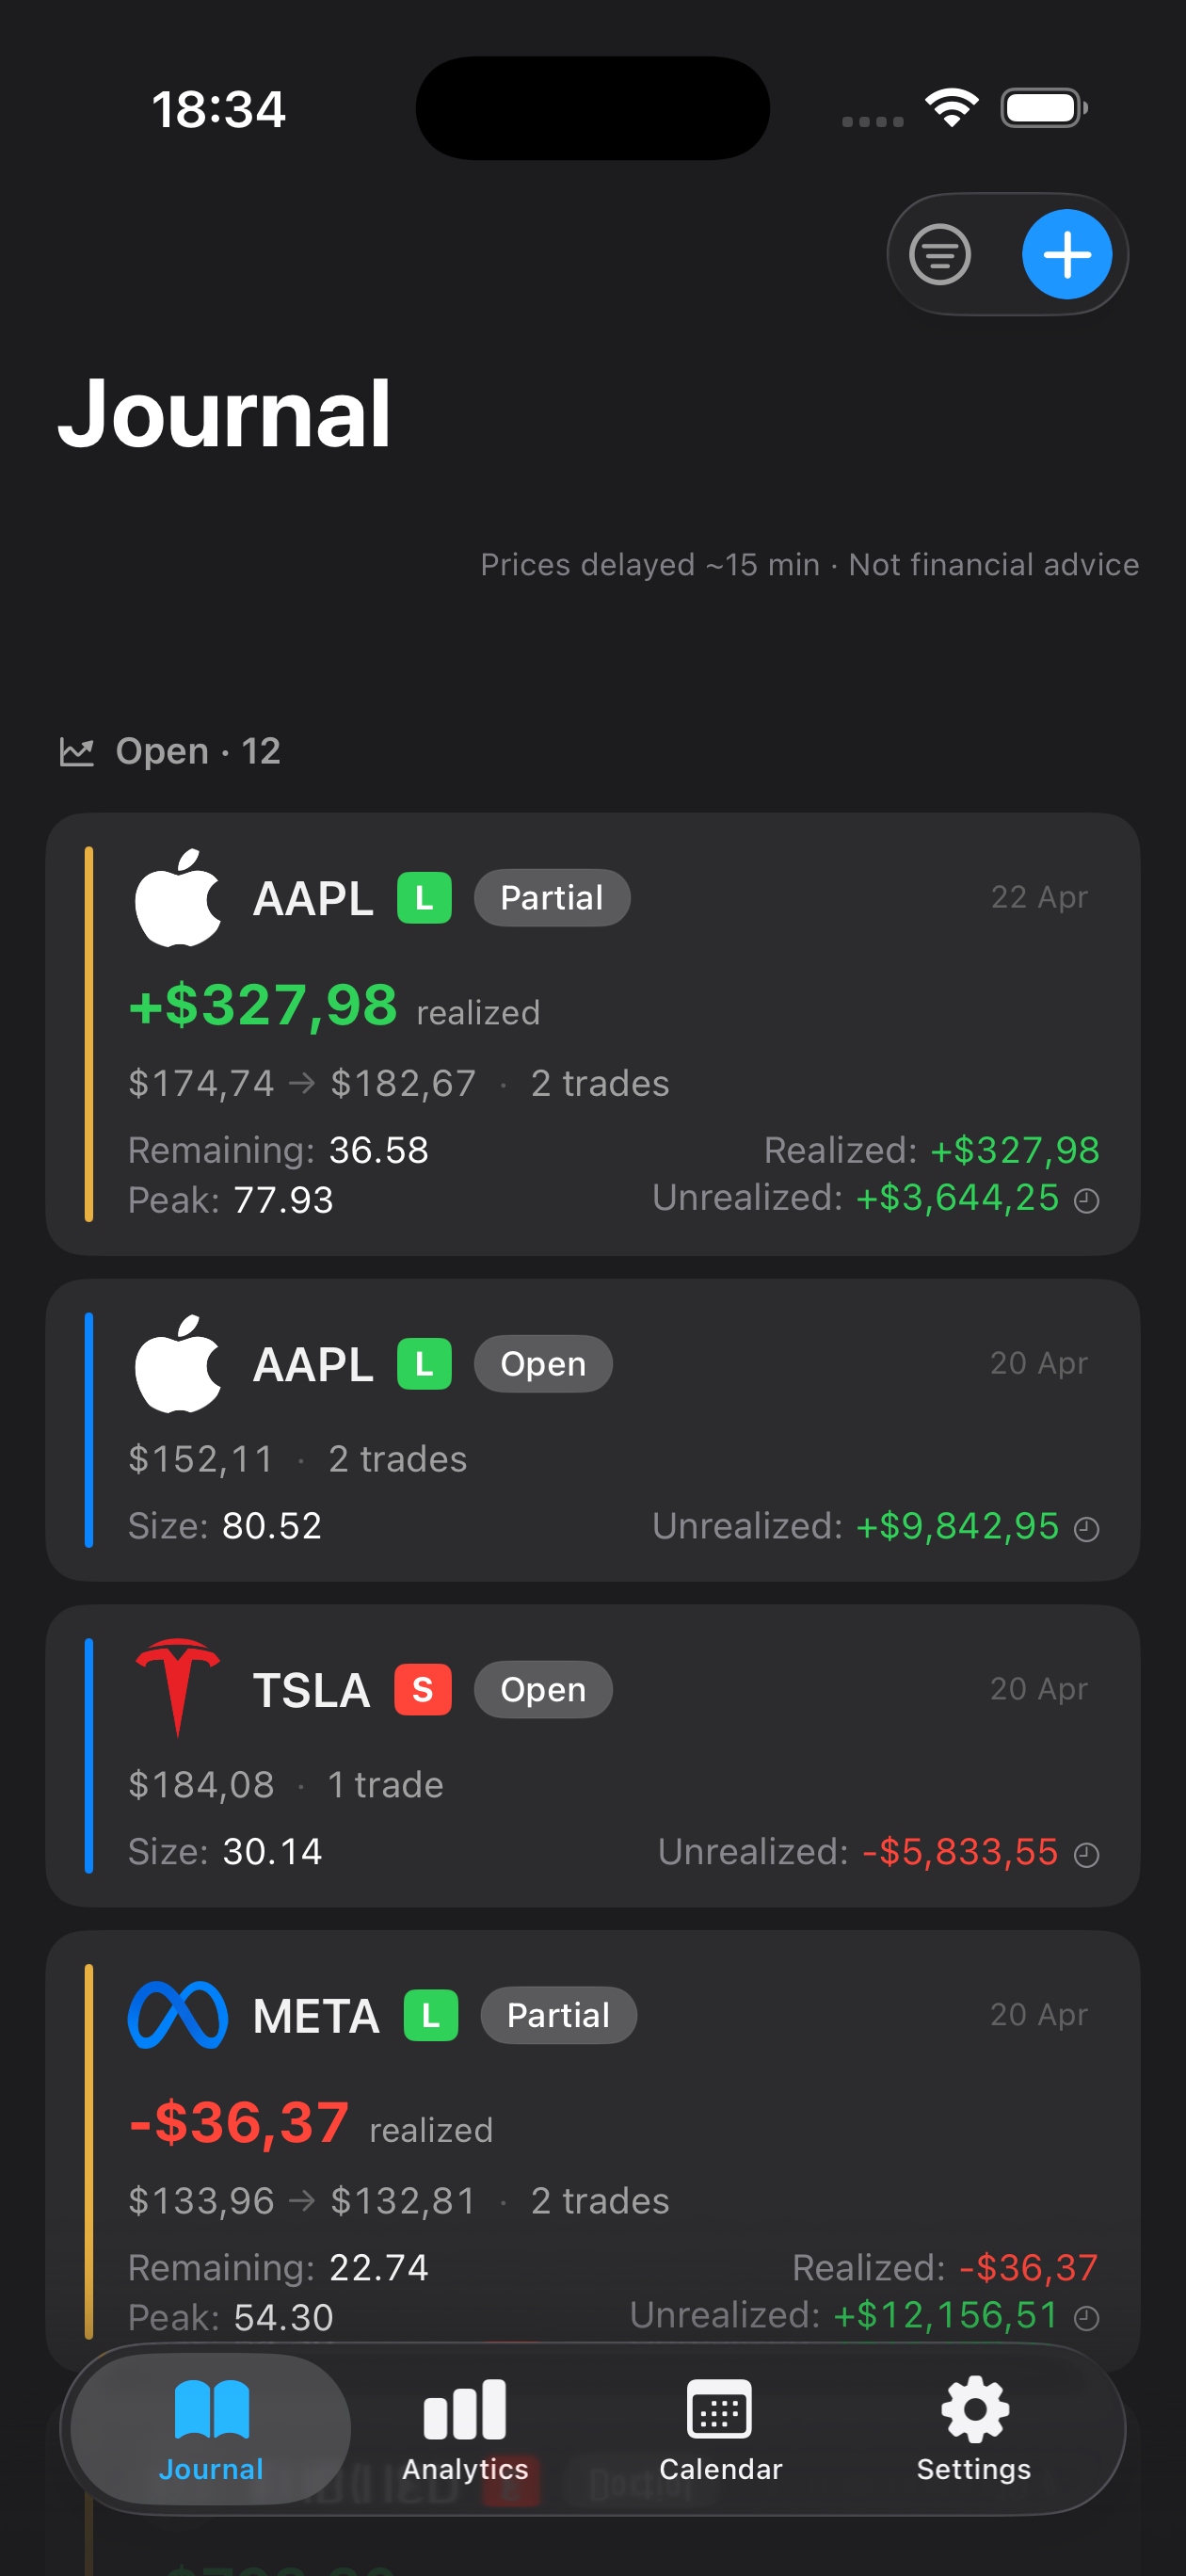
Mantis equity curve and win/loss charts used to review Calmar ratio performance Mantis trading journal on iPhone — the trade log Mantis uses to calculate Calmar ratio

Mantis tracks Calmar ratio automatically — log each trade once and the number is calculated for you on iPhone.

Download on theApp Store

Opens the App Store

In a nutshell

The formula

Calmar ratio = Annual return ÷ Maximum drawdown (as a decimal). For example: suppose a trading strategy earned 24% over a year and experienced a maximum drawdown of 12%. The Calmar ratio would be 24 ÷ 0.12 = 2.0. Another example: a strategy that returned 18% with a maximum drawdown of 30% would have a Calmar ratio of 18 ÷ 0.30 = 0.6. The first strategy generated more return per unit of risk.

Why it matters

Calmar ratio forces you to look at both sides of the equation: raw returns and the pain of getting there. A strategy with 50% annual returns sounds great until you learn it suffered a 60% drawdown—its Calmar ratio (0.83) reveals the volatility cost. Conversely, a modest 12% return with only a 4% drawdown (Calmar ratio 3.0) might be more stable and sustainable. What it can hide: Calmar ratio is sensitive to the timing of the largest loss. A strategy that recovers from one monster drawdown but is otherwise smooth may look worse than one with steady smaller losses. It also doesn't distinguish between a single bad month and a prolonged recovery period.

What's a good Calmar ratio?

A Calmar ratio above 1.0 is generally viewed as acceptable—it means annual return exceeded the size of the largest loss. A ratio of 2.0 or above is considered strong; 3.0+ is excellent. However, the 'good' number depends entirely on your strategy, timeframe, and market. Day traders accepting frequent small losses may target a different ratio than swing traders. A ratio of 1.5 might be strong for a high-drawdown style but weak for a capital-preservation approach. Compare your strategy's Calmar ratio to others using similar methods, not to an absolute benchmark.

Frequently asked questions

Is a higher Calmar ratio always better?

Yes, in general. A higher Calmar ratio means you're generating more return per unit of risk. However, a very high ratio can sometimes be a warning sign if it comes from a very short observation period or a strategy that hasn't been tested in diverse market conditions. Focus on whether the ratio is stable over time, not just whether it's high today.

How is Calmar ratio different from Sharpe ratio?

Sharpe ratio uses volatility (standard deviation of returns) as the risk measure, while Calmar ratio uses maximum drawdown. Sharpe ratio penalizes any ups and downs; Calmar ratio only cares about the worst peak-to-trough loss. For traders focused on surviving large losses, Calmar ratio often feels more intuitive.

Can you calculate Calmar ratio over different time periods?

Yes, you don't have to use one year. You can calculate Calmar ratio over 3 months, 6 months, 2 years, or any period. Just divide the return for that period by the maximum drawdown that occurred within it. Shorter periods can be noisier; longer periods give a more robust picture.

What if my strategy has no drawdown?

If maximum drawdown is zero, the ratio is technically infinite (or undefined). In practice, this rarely happens; most trading strategies experience at least a small losing period. If you're backtesting and hit zero drawdown, it usually means your data window is too short or the strategy is unrealistic.

Should I only compare strategies by Calmar ratio?

No. Calmar ratio is one useful lens, but it's incomplete. Also consider win rate, average trade size, how the strategy performs in different market conditions, and whether the drawdown and recovery match your emotional tolerance. The best strategy for you combines good metrics with a plan you can actually stick to.
Important: Mantis is a trading journal and analytics tool. This page is not investment advice, not financial advice, and not a recommendation to buy or sell any security or instrument. Trading involves risk; past performance does not guarantee future results. Consult a qualified professional before making financial decisions.