Local Trade Logging
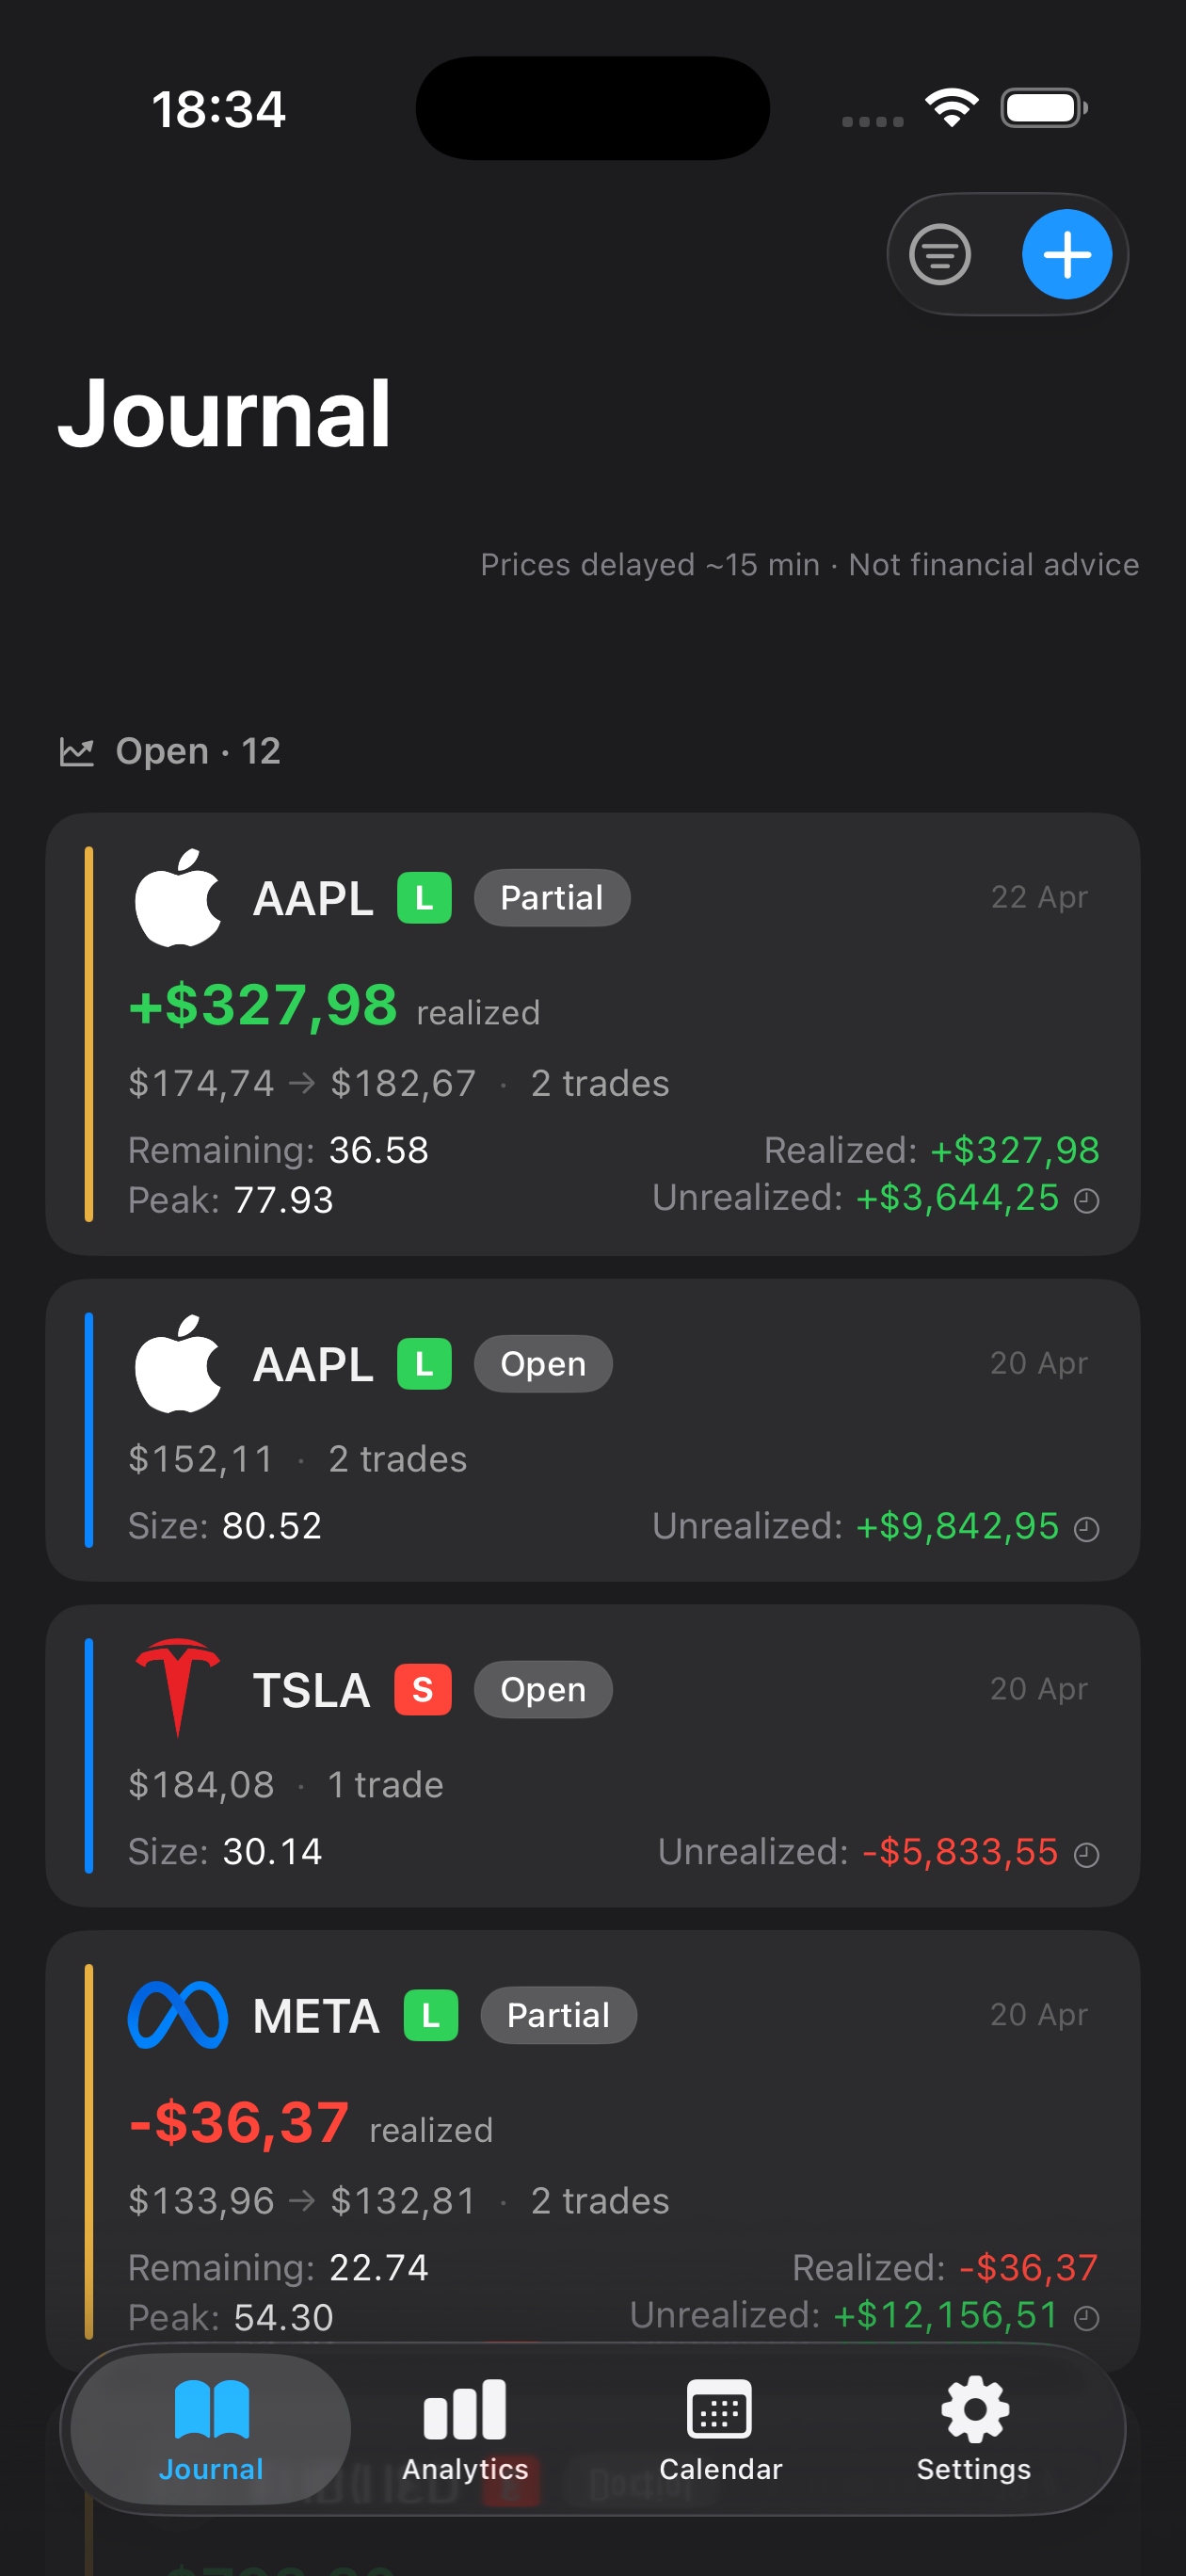
Record every trade's entry, exit, and outcome on your device. Mantis stores all data locally, giving you a complete historical record to calculate drawdowns and returns without relying on cloud storage.
The Calmar ratio measures the consistency of your returns relative to the largest peak-to-trough drawdown in your account. A higher Calmar ratio indicates you're generating returns with fewer extreme losses—a key insight into whether your strategy prioritizes capital preservation. Tracking this metric in a trading journal helps you identify periods when your risk management is working and when it needs adjustment. By reviewing your Calmar ratio regularly, you build awareness of the trade-offs between growth and stability in your own trading behavior.
New to Calmar ratio? Read the definition, formula & example →
Opens the App Store
Record every trade's entry, exit, and outcome on your device. Mantis stores all data locally, giving you a complete historical record to calculate drawdowns and returns without relying on cloud storage.
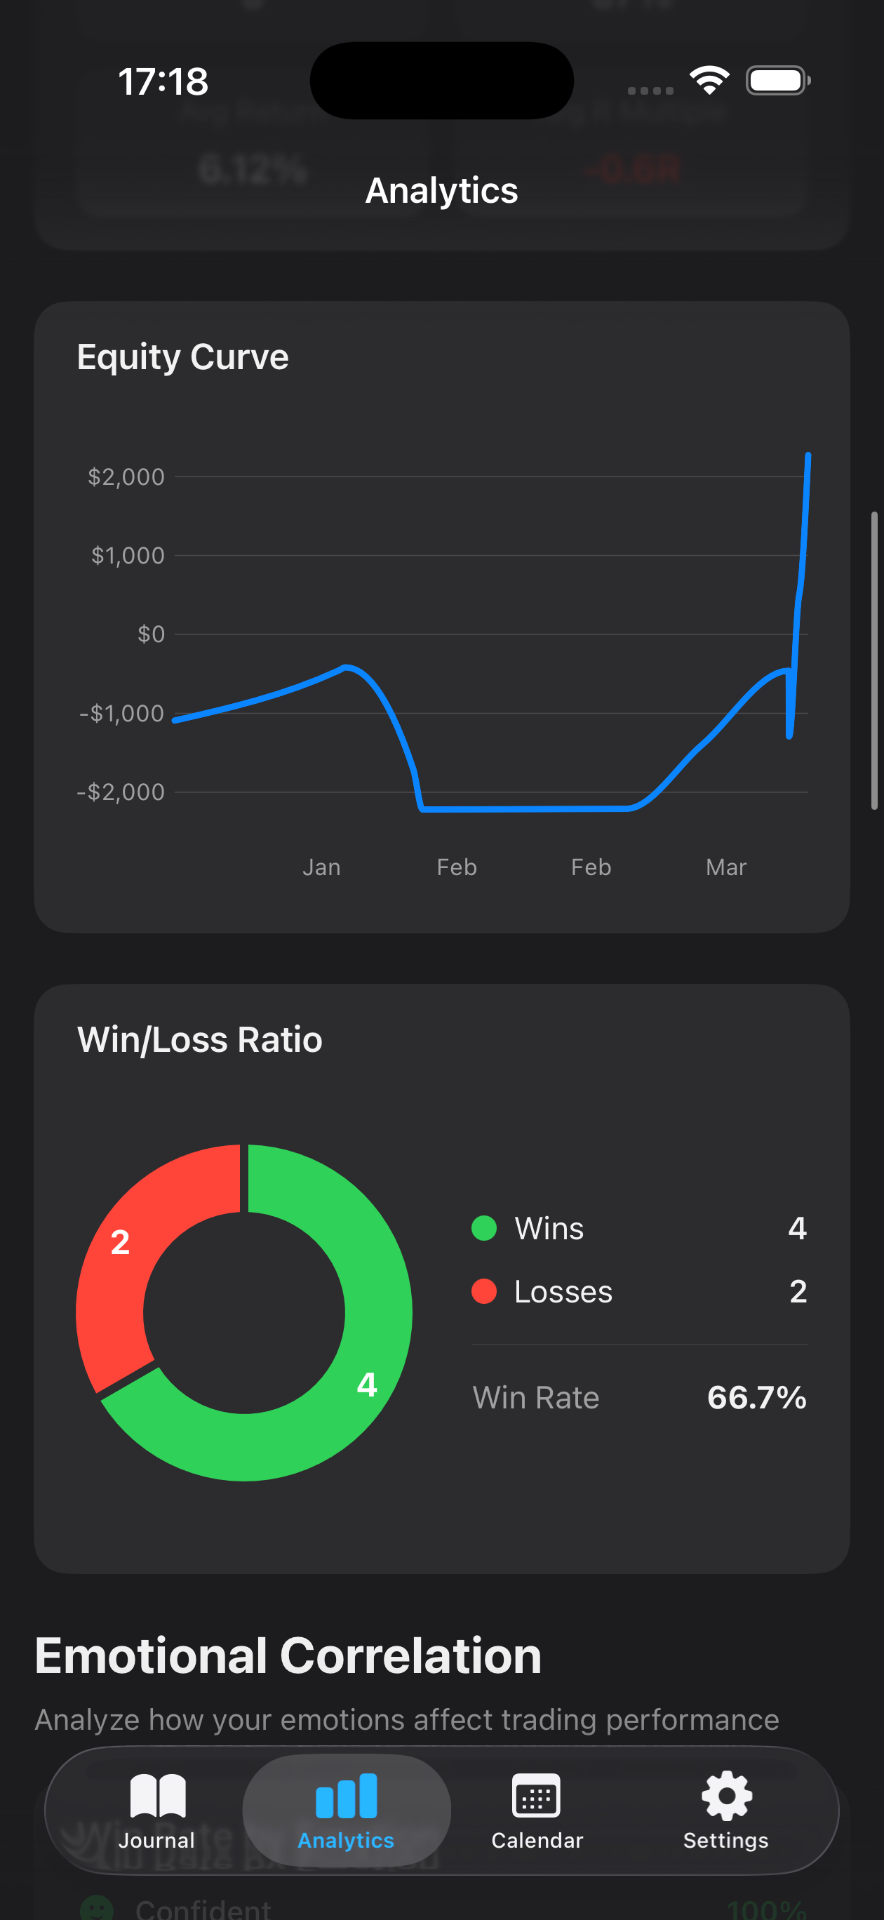
See your account equity curve and peak-to-trough losses at a glance. Understanding your maximum drawdown is essential for computing Calmar ratio—Mantis makes it easy to spot these periods in your journal.
Compare returns over defined time frames (monthly, quarterly, annual). Calmar ratio requires pairing returns with drawdown over the same period, so tracking consistent measurement windows is critical.
Use your journal to calculate and log Calmar ratio alongside other statistics. Review trends over time to see whether your strategy's risk-adjusted performance is improving or deteriorating.
All data stays on your device—no syncing, no cloud access. Compute your metrics and analyze your performance in confidence, with complete control over your trading information.
The Calmar ratio divides your net profit (or return) over a given period by the maximum drawdown in that same period. It answers: 'For every unit of loss I risked, how much profit did I make?' A ratio of 3.0 means you earned $3 for every $1 of peak-to-valley loss. Higher is generally better, but context matters—compare it to your own baseline and trading style.
The Calmar ratio forces you to think about both sides of the equation: returns and drawdowns. By journaling trades consistently and calculating this metric over time, you gain insight into whether you're truly managing risk or simply getting lucky. It also helps you spot when your discipline is slipping and losses are accelerating.
Most traders calculate Calmar ratio monthly or quarterly to identify trends without noise from daily fluctuations. Some review it annually. The key is consistency—pick a time frame, stick with it, and record it in your journal so you can compare periods and see if your strategy's risk-adjusted performance is stable.
No. Historical Calmar ratio reflects past performance under specific market conditions. It is a useful diagnostic tool to review your behavior and risk management, but markets change and past results do not predict future outcomes. Use your journal to track whether the conditions that produced your ratio are still present.
Yes. Keep separate journal entries or sections for each account or strategy, and calculate Calmar ratio independently for each. This reveals which approaches manage drawdown best and helps you refine your overall approach. Mantis lets you organize and review entries by date and context so you can segment your analysis clearly.
Important: Mantis is a trading journal and analytics tool. This page is not investment advice, not financial advice, and not a recommendation to buy or sell any security or instrument. Trading involves risk; past performance does not guarantee future results. Consult a qualified professional before making financial decisions.