iOS trading journal
← Trading terms glossary

What Is Sharpe Ratio?

The Sharpe ratio is a measure of risk-adjusted return that tells you how much excess return you earned per unit of risk taken. It's calculated by dividing your average return above the risk-free rate by the standard deviation of your returns. Traders use the Sharpe ratio to compare strategies or portfolios on an apples-to-apples basis: a higher Sharpe ratio means you're getting more return for each unit of volatility you endure, making it easier to evaluate whether your gains are due to skill or simply taking on excessive risk.

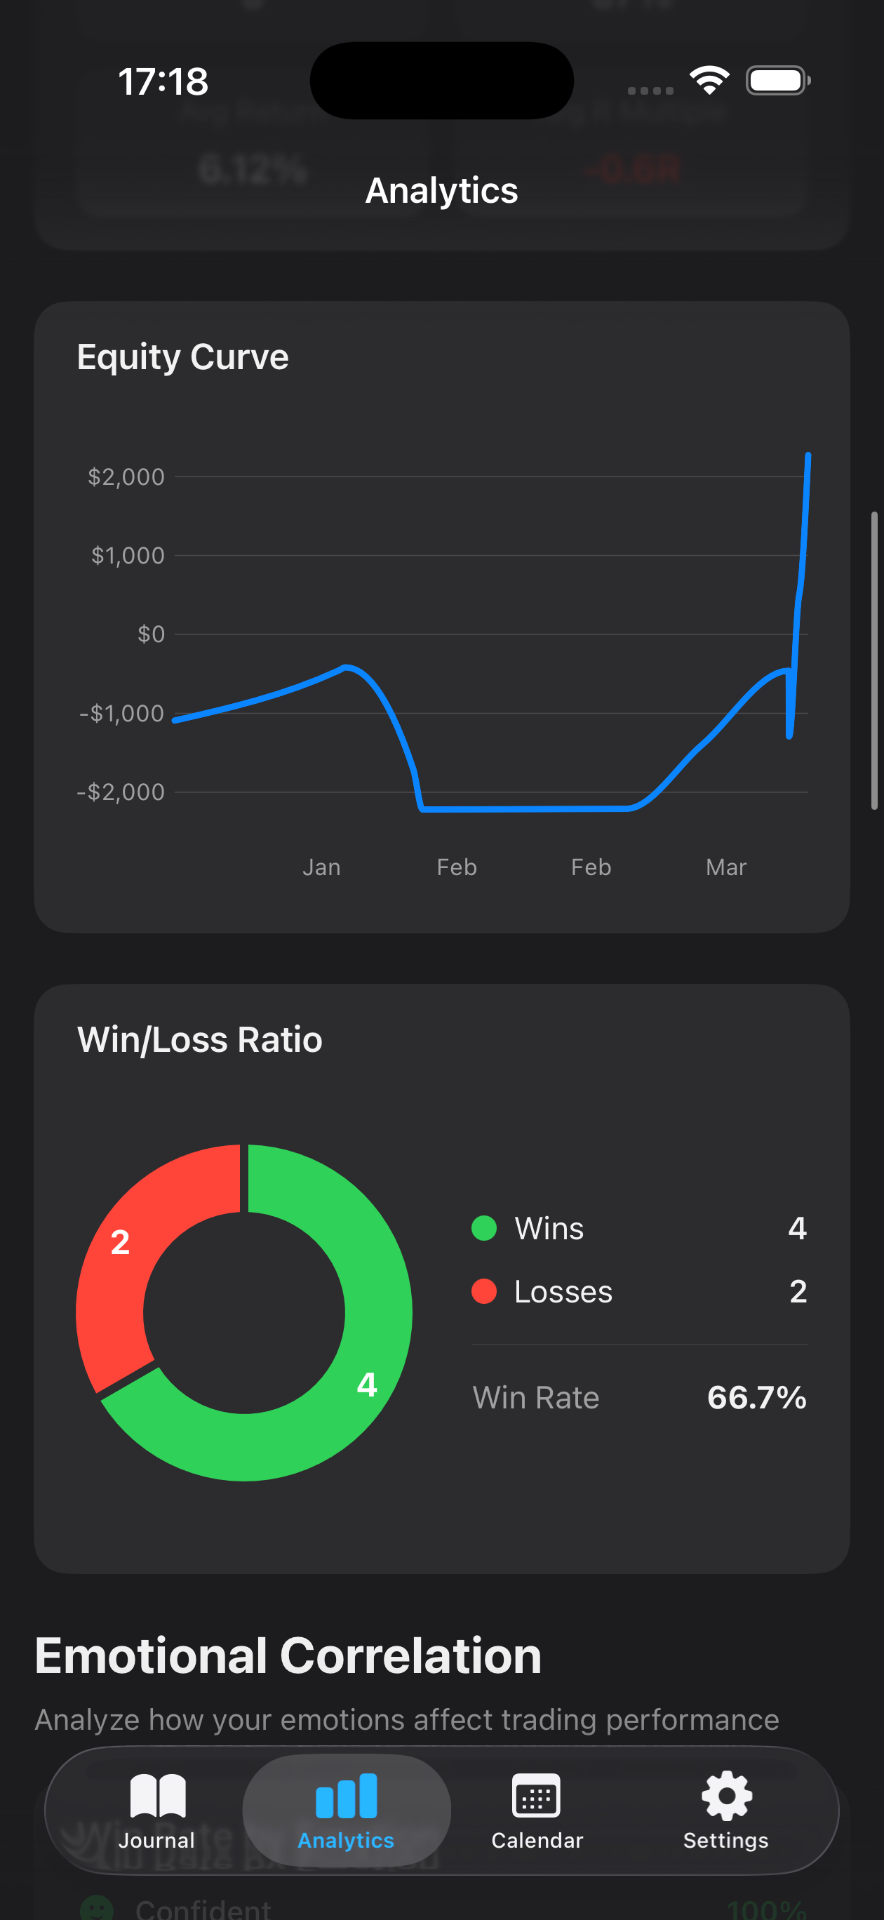
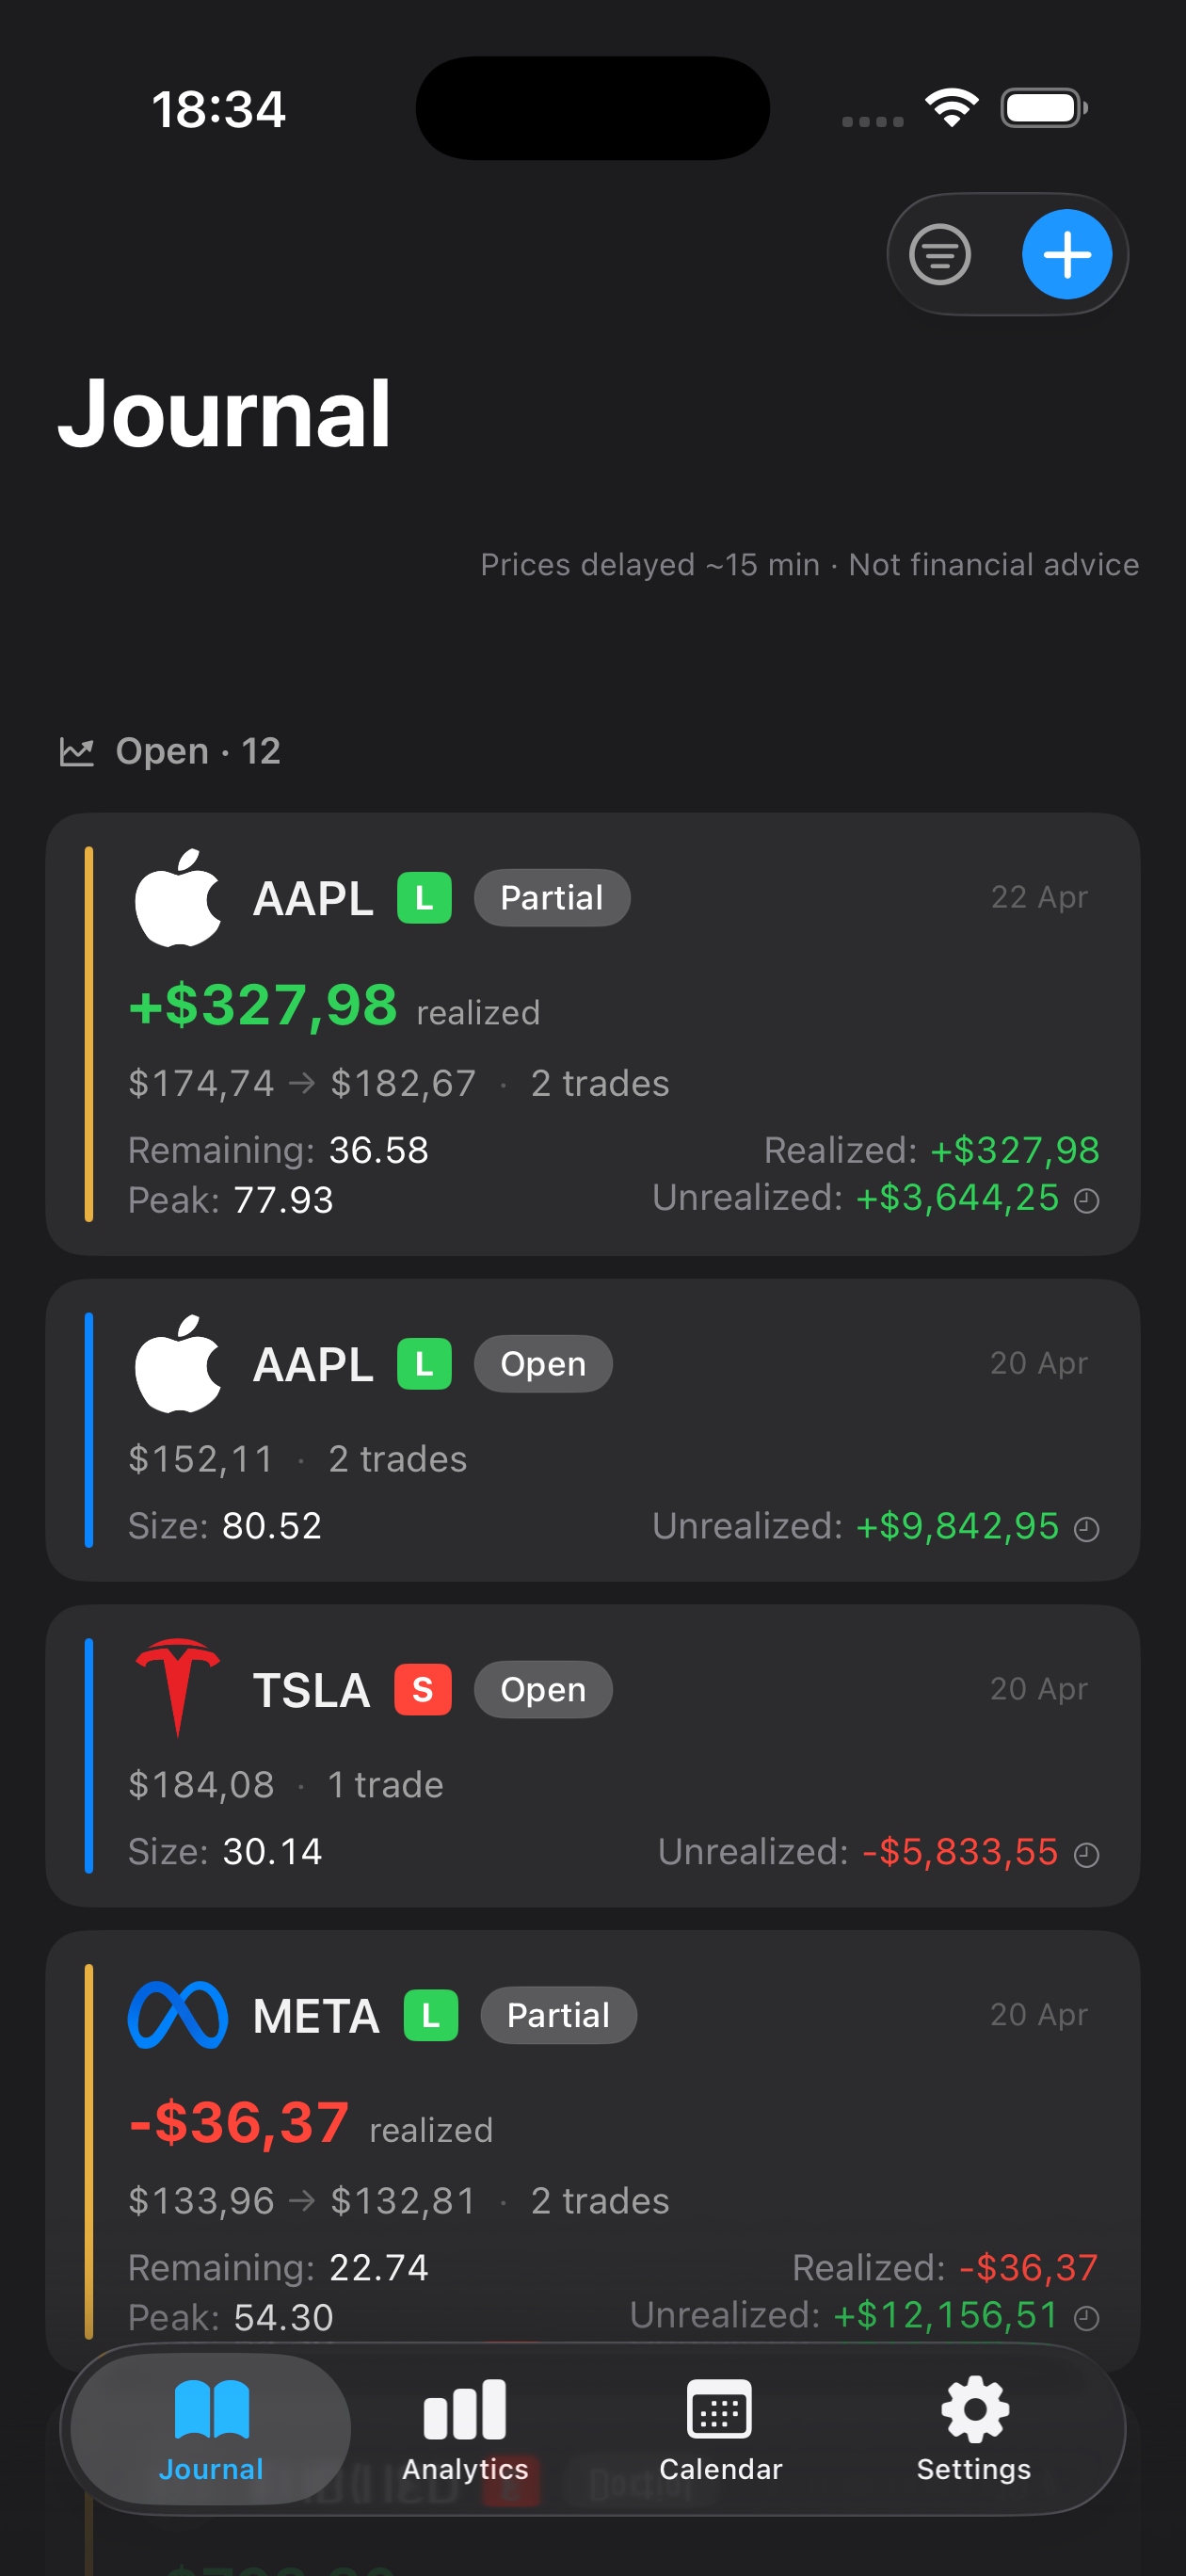
Mantis equity curve and win/loss charts used to review Sharpe ratio performance Mantis trading journal on iPhone — the trade log Mantis uses to calculate Sharpe ratio

Mantis tracks Sharpe ratio automatically — log each trade once and the number is calculated for you on iPhone.

Download on theApp Store

Opens the App Store

In a nutshell

The formula

The Sharpe ratio formula is: (Average Return − Risk-Free Rate) ÷ Standard Deviation of Returns. For example, if your trading strategy averages 18% annual return with a standard deviation of 12%, and the risk-free rate (like Treasury bills) is 3%, your Sharpe ratio is (18% − 3%) ÷ 12% = 1.25. This means you earned 1.25 units of excess return for every unit of volatility. The standard deviation measures how much your returns bounce around: wider swings mean higher risk, which drags the ratio down even if your average return looks strong.

Why it matters

Sharpe ratio reveals whether you're being compensated fairly for the risk you take. A strategy that returns 30% per year sounds great until you learn it swings wildly and has a Sharpe ratio of 0.5, meaning you're taking on enormous volatility for modest risk-adjusted gain. Conversely, a 15% return with low volatility might have a Sharpe ratio above 2.0, signaling consistent, efficient performance. However, the ratio can hide important details: it treats upside and downside volatility the same, assumes returns are normally distributed, and doesn't capture tail risk or drawdown depth. It's a useful benchmark, not a complete picture of a strategy's quality.

What's a good Sharpe ratio?

A Sharpe ratio above 1.0 is generally considered acceptable, above 2.0 is very good, and above 3.0 is excellent—but context matters enormously. High-frequency strategies and market-neutral trades often target Sharpe ratios above 2.0, while directional equity strategies might see 0.5 to 1.5 as realistic. Lower timeframes and more frequent trading can inflate the ratio, and different asset classes have different risk profiles. What counts as "good" depends on your strategy type, holding period, market conditions, and whether you're comparing to passive benchmarks or active peers. Use the Sharpe ratio as one tool among many, not a single scorecard.

Frequently asked questions

Is a higher Sharpe ratio always better?

Generally yes, but not in isolation. A very high Sharpe ratio can result from strategies with limited data, survivorship bias, or returns that don't follow normal distributions. It also doesn't account for liquidity, maximum drawdown, or how long losing streaks last. Compare Sharpe ratios within the same asset class and timeframe, and always look at other metrics like Sortino ratio, maximum drawdown, and win rate to get the full picture.

How is Sharpe ratio different from win rate?

Win rate tells you what percentage of your trades are profitable, but says nothing about the size of wins versus losses or consistency. Sharpe ratio measures risk-adjusted return: it accounts for both your average gain and how volatile those gains are. You can have a 70% win rate but a poor Sharpe ratio if your losses are huge, or a 40% win rate with a strong Sharpe ratio if your winners far outweigh your losers and returns are steady.

What's the risk-free rate and why does it matter?

The risk-free rate is the return you could earn on a virtually zero-risk investment, typically the yield on short-term government bonds like U.S. Treasury bills. It represents the baseline return available without taking market risk. Subtracting it from your trading returns isolates the "excess return" you earned by taking on risk. When risk-free rates rise, your Sharpe ratio can fall even if your absolute returns stay the same, because you're being compared to a higher baseline.

Can Sharpe ratio be negative?

Yes. A negative Sharpe ratio means your average return is below the risk-free rate: you would have been better off in Treasury bills than taking on the volatility of your strategy. It signals that risk is not being rewarded. A strategy with a negative Sharpe ratio is losing money on a risk-adjusted basis and should be re-evaluated or abandoned unless there's a short-term drawdown you're willing to ride out.

Does Sharpe ratio work for all trading styles?

It's useful across styles but has limitations. For strategies with asymmetric return profiles—like options selling, where you collect small premiums most of the time but face rare large losses—Sharpe ratio can look deceptively strong until a tail event hits. It also assumes returns are normally distributed, which isn't true for many real trading strategies. For these cases, complement Sharpe ratio with metrics like Sortino ratio (which penalizes only downside volatility) and maximum drawdown to capture risk more fully.
Important: Mantis is a trading journal and analytics tool. This page is not investment advice, not financial advice, and not a recommendation to buy or sell any security or instrument. Trading involves risk; past performance does not guarantee future results. Consult a qualified professional before making financial decisions.