Log Every Trade's Return
Record each trade's percentage gain or loss so you can calculate your mean return and standard deviation—the two components of Sharpe ratio—across any timeframe.
The Sharpe ratio measures how much return you earn per unit of risk, making it one of the most important metrics for evaluating trading performance. By tracking Sharpe ratio in your journal, you move beyond simple profit and loss to understand whether your returns justify the volatility you're accepting. A higher Sharpe ratio indicates more efficient use of risk, while a declining ratio can reveal when your edge is eroding or your position sizing has become inconsistent. Mantis helps you capture the data needed to calculate and monitor your Sharpe ratio over time, turning this statistical measure into actionable insight stored securely on your device.
New to Sharpe ratio? Read the definition, formula & example →
Opens the App Store
Record each trade's percentage gain or loss so you can calculate your mean return and standard deviation—the two components of Sharpe ratio—across any timeframe.
Use tags to segment trades by setup, instrument, or volatility regime, then compare Sharpe ratios across groups to identify which strategies deliver the best risk-adjusted returns.
Note entry and exit timestamps to annualize your Sharpe calculations accurately, ensuring short-term and long-term strategies are evaluated on a comparable basis.
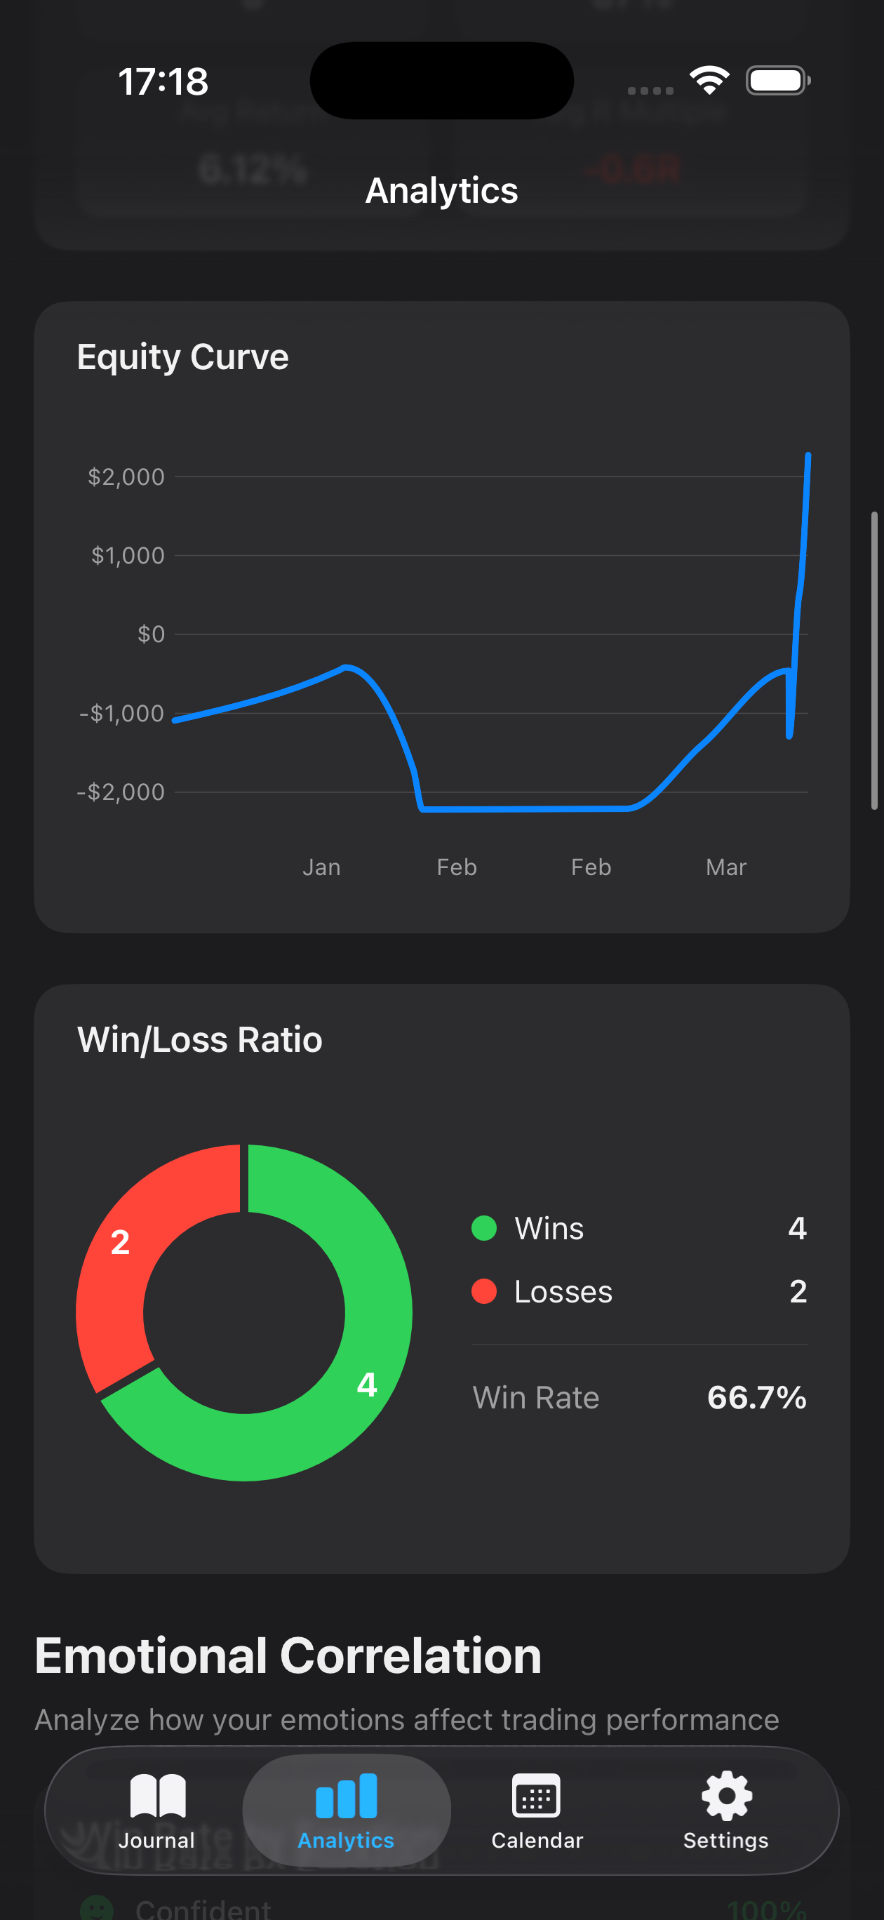
Visualize daily and weekly returns to spot patterns in volatility and drawdowns, helping you understand the consistency behind your Sharpe ratio rather than relying on the number alone.
Document your position sizing, stop-loss placement, and exposure limits for each trade, creating a qualitative record that explains the quantitative risk captured in your Sharpe ratio.
All trade logs, returns, and calculations stay on your device only—no cloud sync, no external servers—so your performance metrics remain completely private.
The Sharpe ratio divides your average excess return (return above the risk-free rate) by the standard deviation of those returns. It tells you how much reward you're getting for each unit of volatility you accept.
Many traders review Sharpe ratio monthly or quarterly to smooth out short-term noise. Logging every trade in your journal gives you the raw data to calculate it at whatever interval makes sense for your strategy and timeframe.
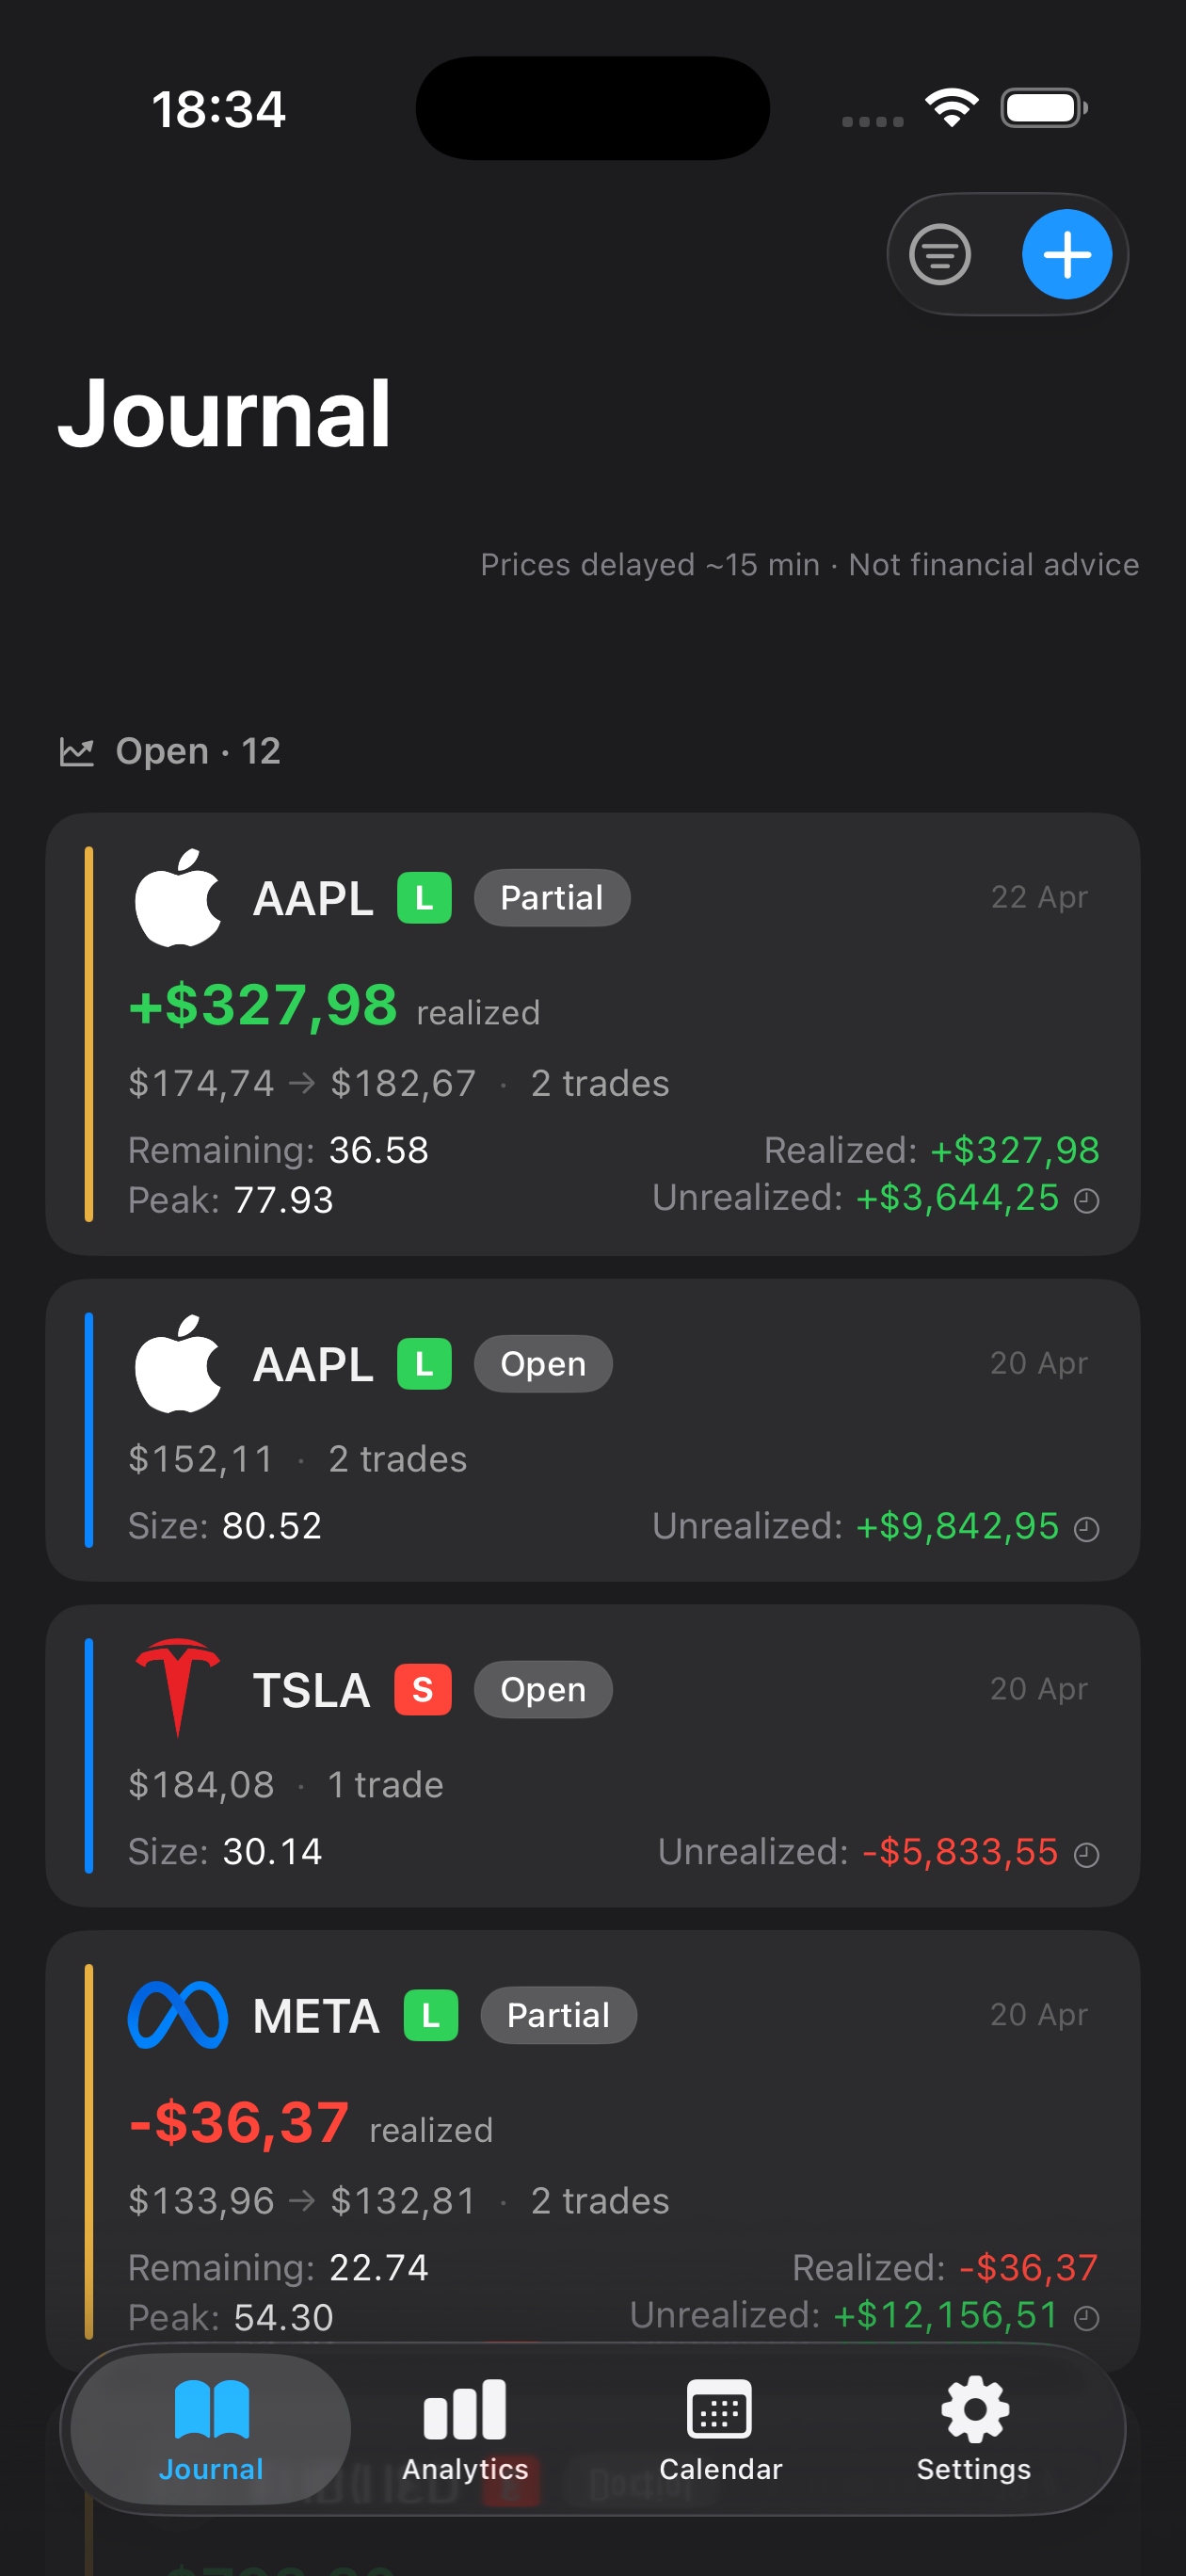
Mantis captures the trade-level details—returns, dates, tags—that feed into Sharpe calculations. You can perform the math in a spreadsheet or reference your journal data to understand the inputs behind any ratio you compute.
Yes. By tagging trades by strategy or instrument in Mantis, you can isolate subsets of trades and calculate separate Sharpe ratios, revealing which approaches deliver the most efficient risk-adjusted performance.
Total profit ignores risk. Two traders can make the same dollar amount, but the one with lower volatility and smaller drawdowns has a higher Sharpe ratio—indicating a more sustainable, repeatable edge.
Important: Mantis is a trading journal and analytics tool. This page is not investment advice, not financial advice, and not a recommendation to buy or sell any security or instrument. Trading involves risk; past performance does not guarantee future results. Consult a qualified professional before making financial decisions.