iOS trading journal
← Trading terms glossary

What Is Sortino Ratio?

The Sortino ratio is a risk-adjusted performance metric that measures how much return a trader generates for each unit of downside risk (losses) they take on. Unlike standard deviation, which penalizes all volatility equally, Sortino ratio only counts negative price swings—the kind that actually hurt your account. Traders pay attention to it because it rewards consistent strategies that minimize losses, not just strategies that bounce around a lot.

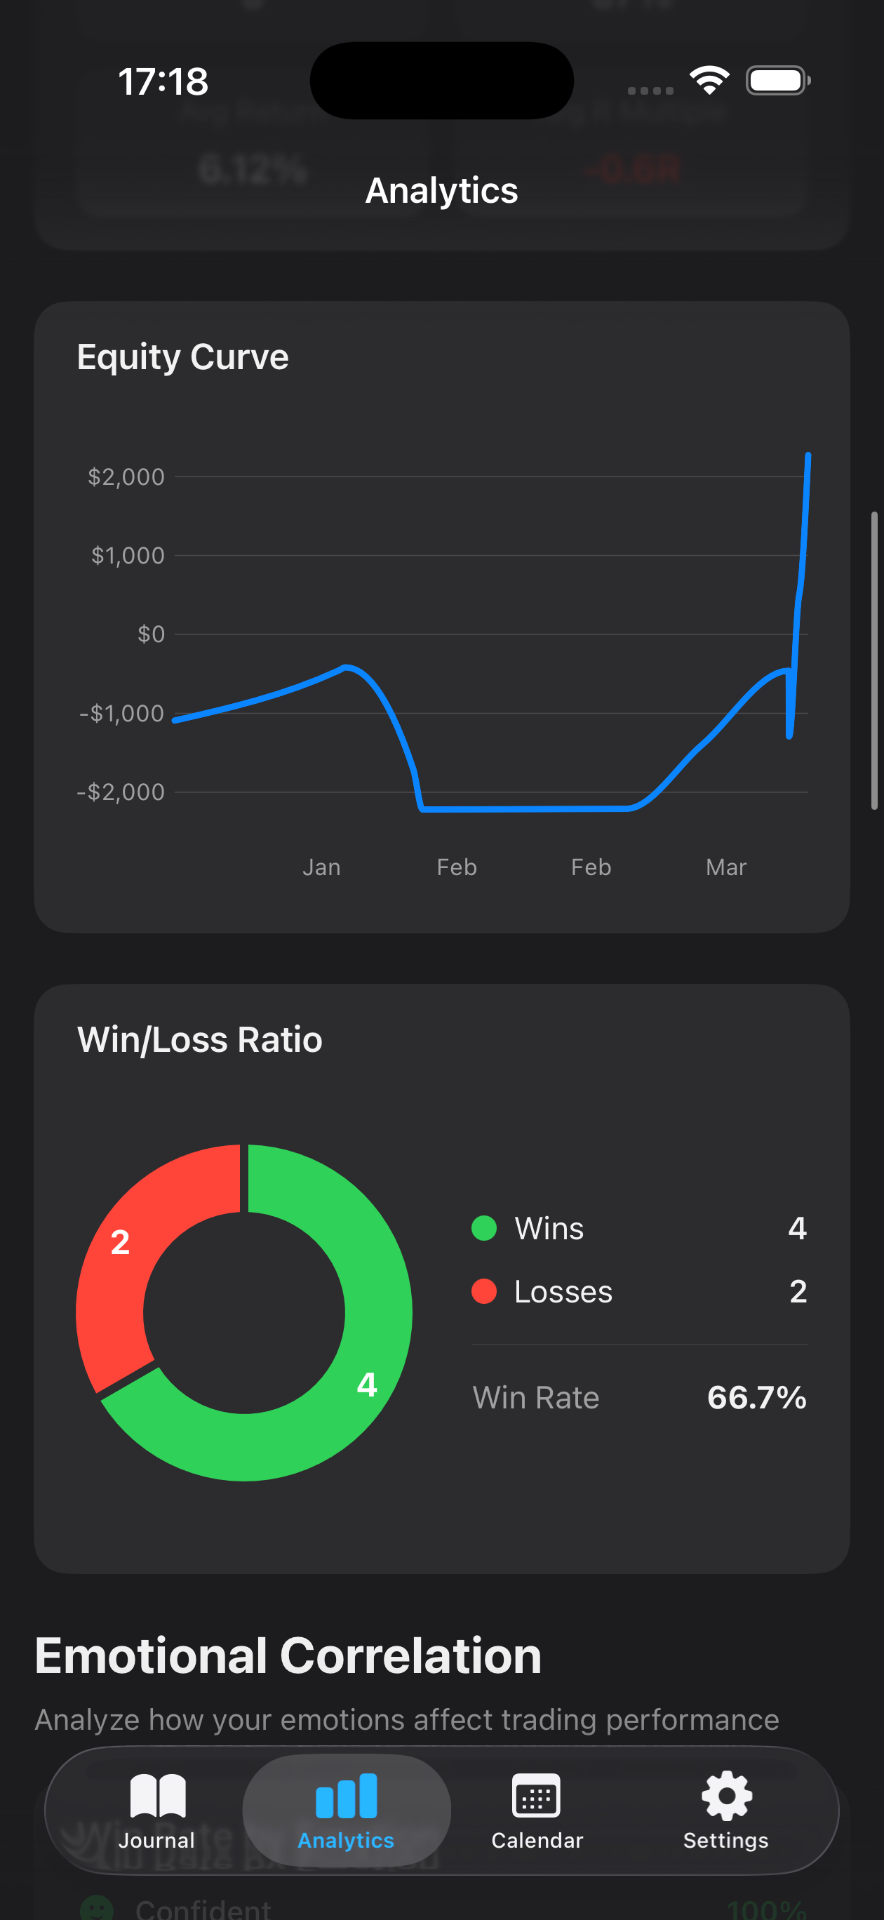
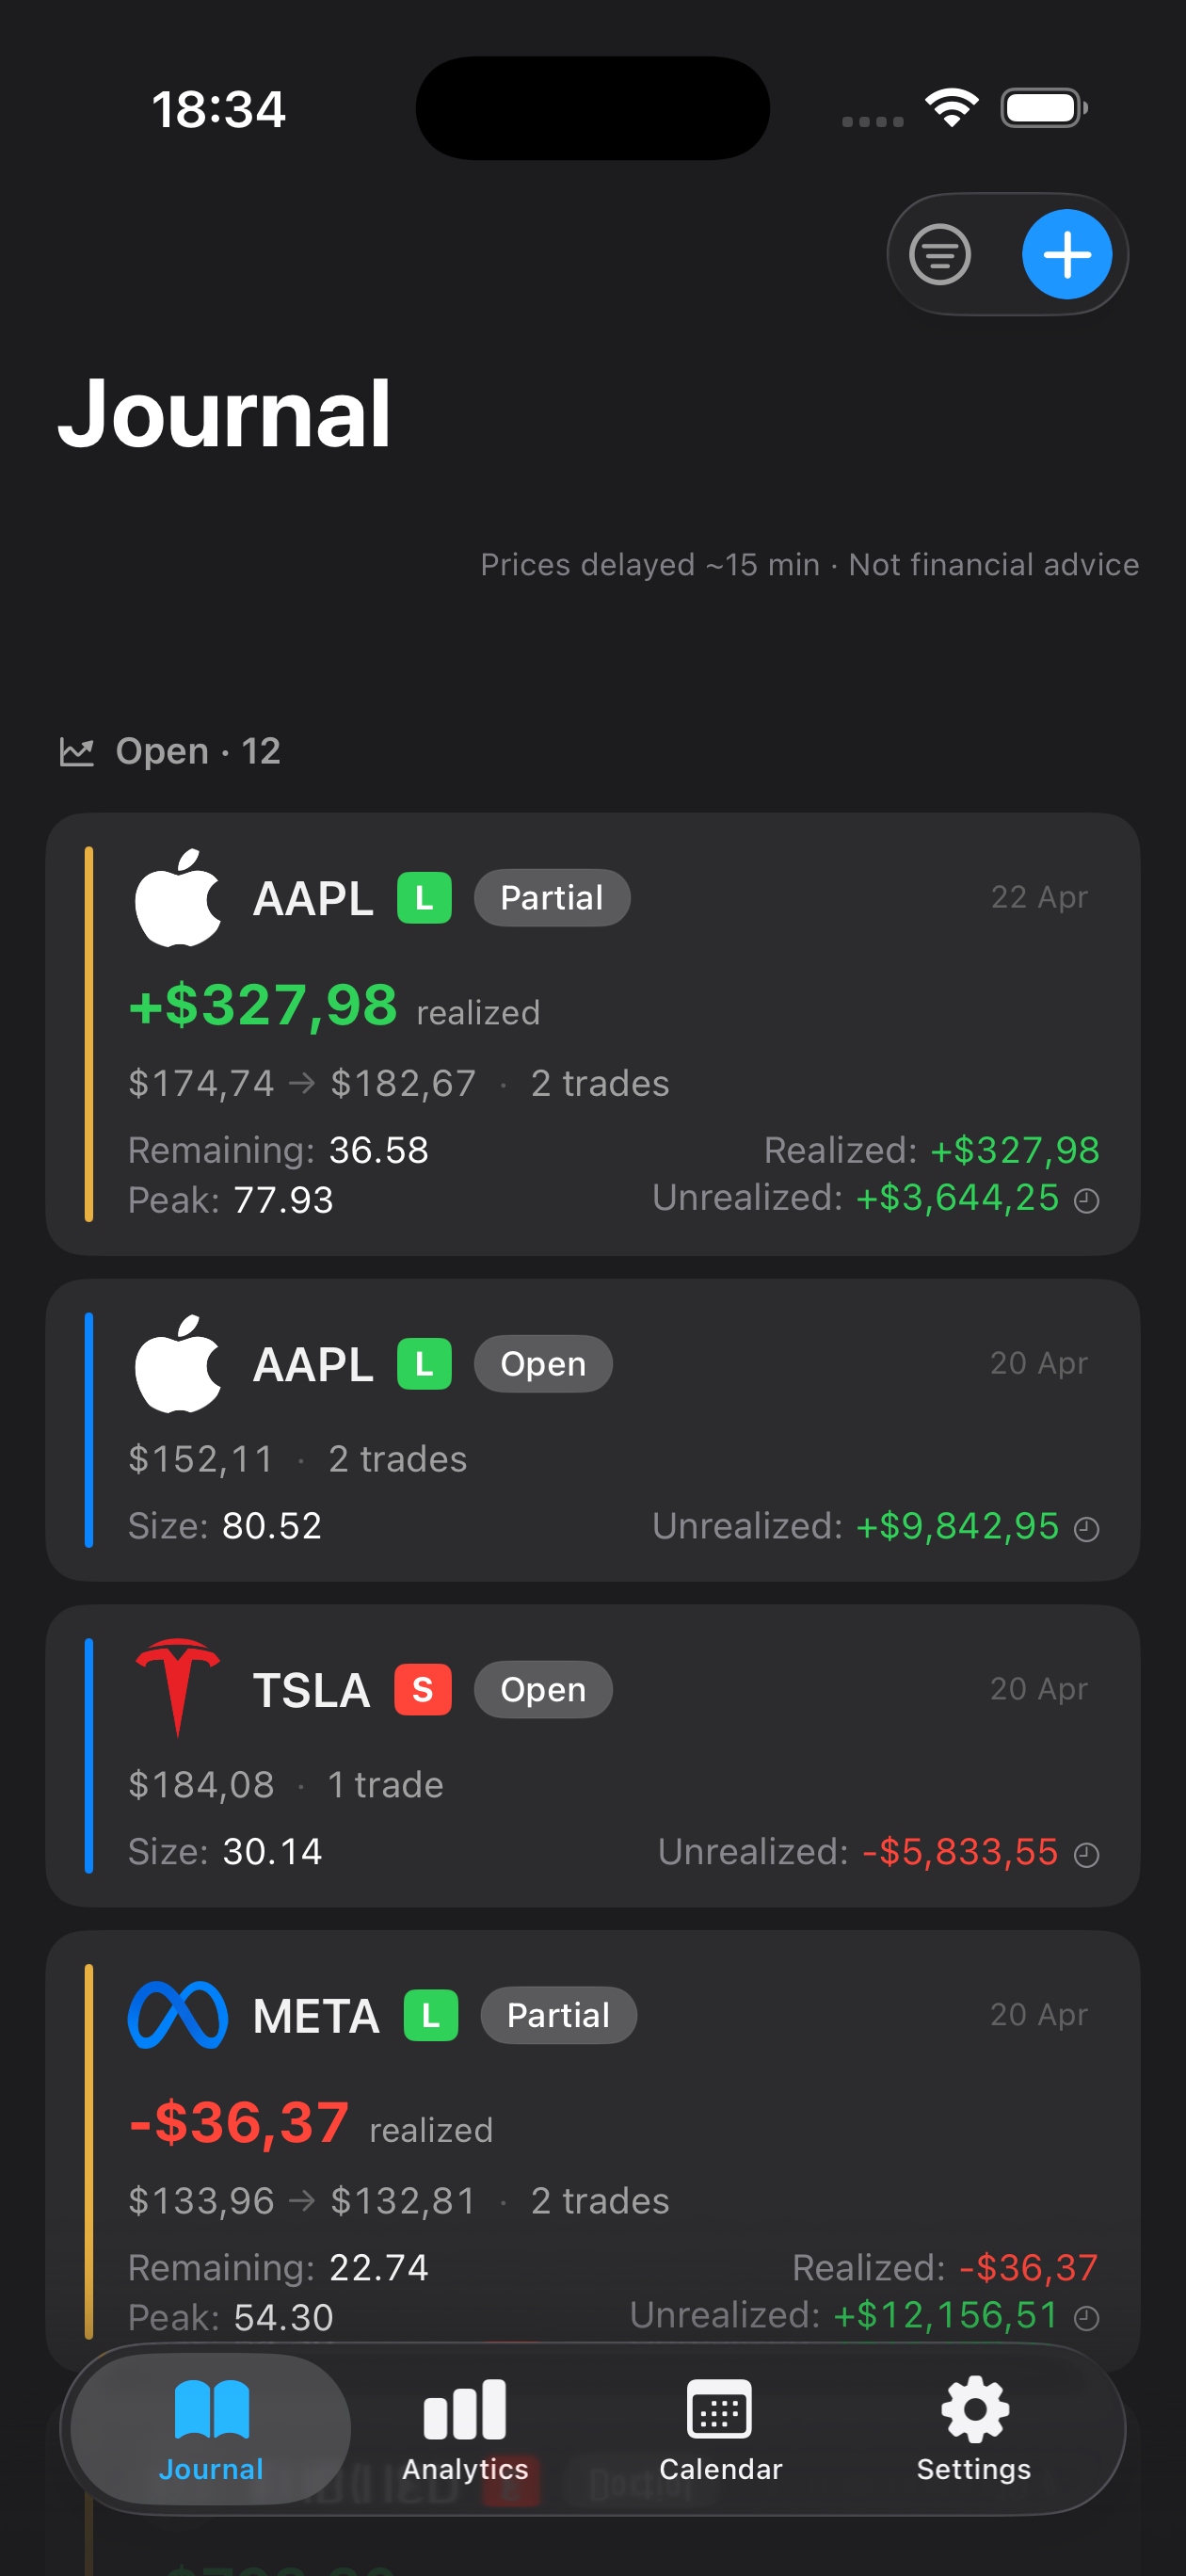
Mantis equity curve and win/loss charts used to review Sortino ratio performance Mantis trading journal on iPhone — the trade log Mantis uses to calculate Sortino ratio

Mantis tracks Sortino ratio automatically — log each trade once and the number is calculated for you on iPhone.

Download on theApp Store

Opens the App Store

In a nutshell

The formula

Sortino ratio = (Average Return − Target Return) ÷ Downside Deviation **Downside Deviation** is the standard deviation of returns that fall below a target (usually 0% or risk-free rate)—only negative returns count. **Worked example:** Imagine you made six monthly trades with returns: +3%, +2%, −1%, +4%, −2%, +1% - Average return = (+3 + 2 − 1 + 4 − 2 + 1) ÷ 6 = 1.17% - Target return = 0% - Negative months: −1%, −2%; squared and averaged: (1 + 4) ÷ 6 = 0.833; downside deviation = √0.833 ≈ 0.91% - Sortino ratio = (1.17% − 0%) ÷ 0.91% ≈ 1.29 This means for every 1% of downside risk, you earned about 1.29% of return.

Why it matters

Sortino ratio isolates what traders actually care about: avoiding losses. Two strategies might have identical average returns, but if one loses money frequently and the other rarely has a negative month, the second looks better under Sortino ratio—and probably *feels* better too. It can hide, however, the size of your worst single loss or how a few catastrophic drawdowns affect your account psychologically. It also assumes past downside patterns will repeat, which may not hold in new market conditions.

What's a good Sortino ratio?

A Sortino ratio above 1.0 is often considered acceptable—you earn at least 1% return per 1% of downside risk. Above 2.0 is strong, and above 3.0 is excellent. However, context matters enormously: a day trader accepting high downside volatility might target a different ratio than a position trader. Market regime, timeframe, and your personal win rate all change what 'good' means. Compare your ratio to your own historical average and to peers in your strategy type, not to a single magic number.

Frequently asked questions

Is a higher Sortino ratio always better?

Generally yes—a higher Sortino ratio means more return per unit of downside risk. However, an extremely high ratio (e.g., 5.0) might reflect a very small sample size, a lucky streak, or overfitting to past data. Look at both the Sortino ratio and the actual losses and win rate behind it.

How is Sortino ratio different from Sharpe ratio?

Sharpe ratio divides average return by total volatility (up and down). Sortino ratio divides average return by downside volatility only. Because Sortino ignores upside swings, it often shows a more flattering picture of a strategy if you care only about losses. Choose Sortino if downside risk is your main concern; Sharpe if you want to account for all swings equally.

What target return should I use for Sortino ratio?

Most traders use 0% (break-even) or the risk-free rate (e.g., current Treasury yield). Some set it to their minimum acceptable return. The choice changes the ratio—a higher target makes downside deviation larger and the ratio smaller. Stick with one definition consistently so you can track trends in your own performance.

Can I use Sortino ratio if I have very few trades?

Technically yes, but the ratio becomes unreliable. With only 5–10 trades, one big loss or a lucky winning streak can swing the number wildly. Aim for at least 20–30 trades before the ratio starts to be meaningful. Mantis stores all your trade data locally, so you can review it as your sample grows.

Does a high Sortino ratio mean I will keep earning money?

No. Sortino ratio summarizes *past* performance. Markets change, your edge may fade, and new conditions can break patterns you relied on. A good historical Sortino ratio is a sign of disciplined risk management, but it does not promise future results.
Important: Mantis is a trading journal and analytics tool. This page is not investment advice, not financial advice, and not a recommendation to buy or sell any security or instrument. Trading involves risk; past performance does not guarantee future results. Consult a qualified professional before making financial decisions.