Maximum drawdown measures the largest peak-to-trough decline in your account equity before a new peak is reached, and tracking it in your trading journal is essential for understanding your true risk exposure. While many traders focus exclusively on win rates and average gains, max drawdown reveals how much capital you've risked losing during your worst performance periods—information that's critical for position sizing, psychological preparedness, and long-term survival in the markets. By consistently recording your equity curve and drawdown metrics in Mantis, you create a historical record that helps you identify when you're entering dangerous territory, adjust your risk parameters before losses compound, and build the emotional resilience needed to weather inevitable rough patches without abandoning your trading plan.
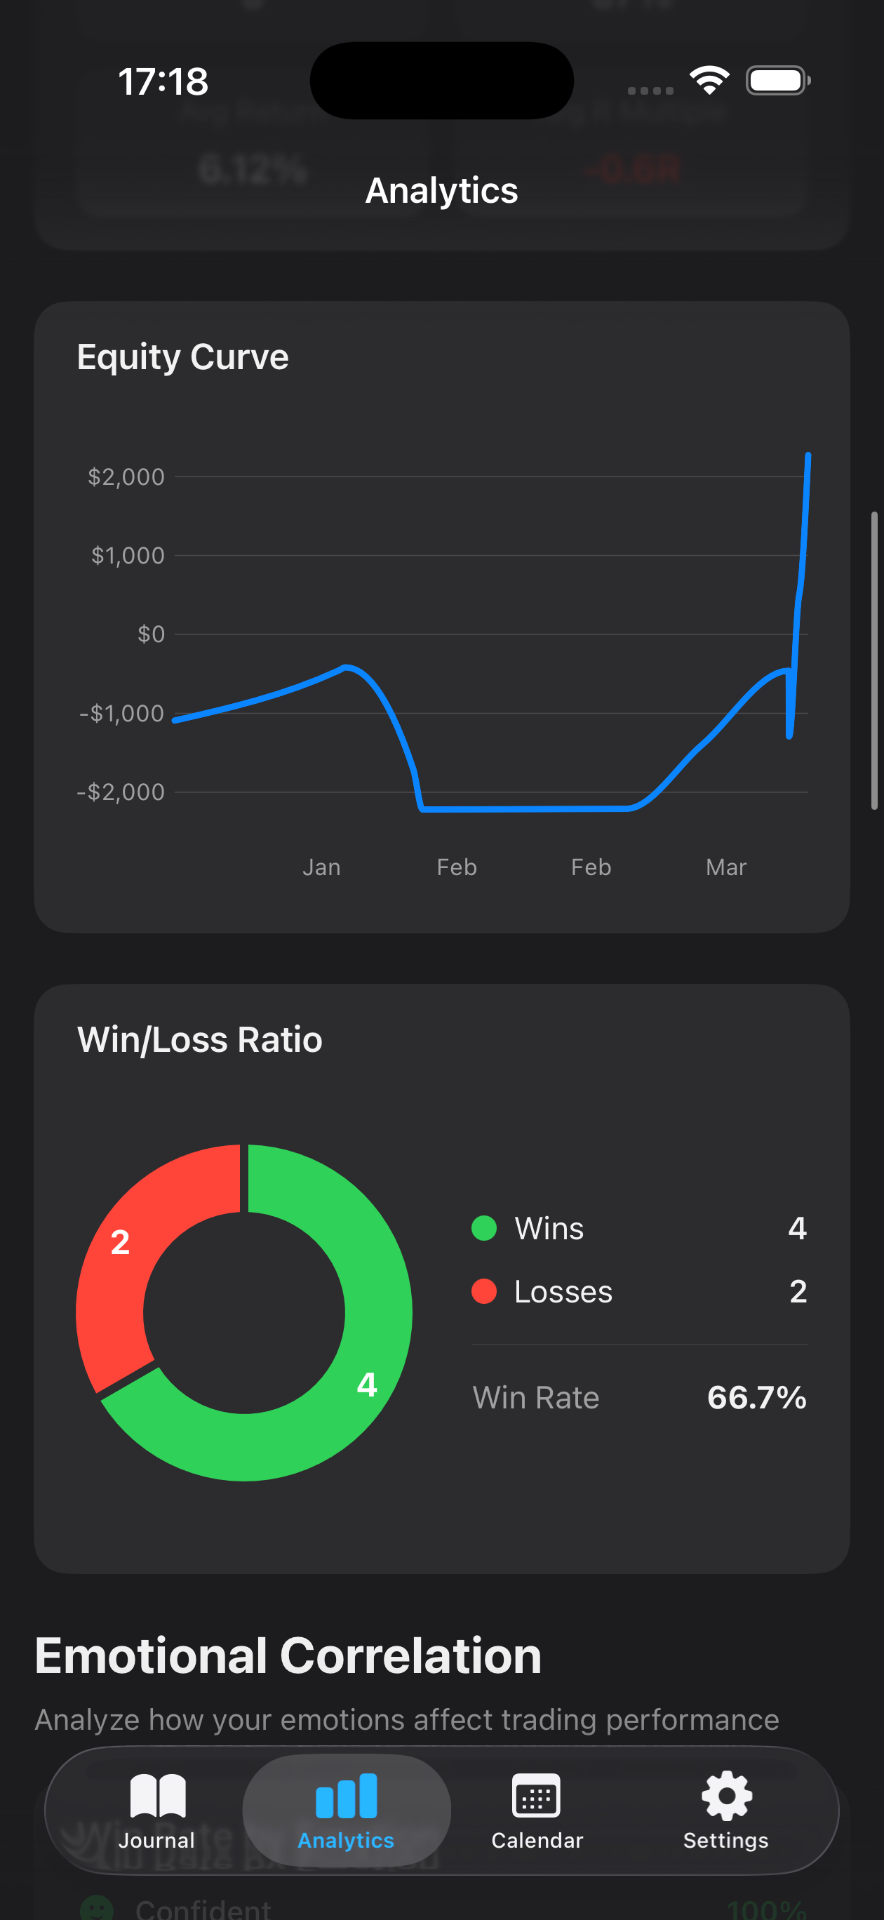
Mantis calculates your running account balance after each trade you log, building a complete equity curve that visually shows every peak and valley in your trading performance—making drawdown periods immediately visible.
Peak-to-Trough Visualization
See exactly when your account reached new highs and how far it fell before recovery, with clear visual markers that help you understand the magnitude and duration of your drawdown periods at a glance.
Historical Drawdown Comparison
Review past drawdown episodes alongside your current performance to identify patterns in what triggered previous declines, how long recovery took, and whether your max drawdown is increasing or decreasing over time.
Trade-Level Contribution Analysis
Drill down into specific trades during drawdown periods to understand which positions, strategies, or market conditions contributed most to peak-to-trough declines, enabling more precise risk management adjustments.
Privacy-Protected Metrics Storage
All your drawdown data, equity curves, and performance statistics stay exclusively on your iPhone—never transmitted, never backed up to cloud services—so your most sensitive risk metrics remain completely private.
Frequently asked questions
What exactly does max drawdown measure in trading?
Max drawdown represents the largest percentage or dollar decline from a peak in your account equity to the lowest point before a new peak is established. It measures your worst-case loss during a specific period and helps quantify the risk you've actually experienced, not just the risk you anticipated.
How often should I review my max drawdown in my journal?
Most traders benefit from checking drawdown metrics weekly or monthly to spot deteriorating risk control before losses compound. During active drawdown periods, more frequent review helps you stay aware of how close you are to predefined risk limits, while in stable periods, less frequent checks prevent over-analysis.
Should I track max drawdown as a percentage or dollar amount?
Tracking both provides the most complete picture. Percentage drawdown shows proportional risk relative to account size and makes historical comparisons easier as your capital changes, while dollar drawdown reveals the actual money at stake and can have more psychological impact on trading decisions.
How does tracking max drawdown improve my trading discipline?
Recording drawdown creates objective accountability by documenting when your risk exposure exceeds comfortable levels. This historical record helps you recognize warning signs earlier in future drawdowns, stick to predetermined stop-loss rules for your overall account, and avoid the emotional decision-making that often makes drawdowns worse.
What's the difference between current drawdown and max drawdown?
Current drawdown measures how far your account is below its most recent peak right now, while max drawdown is the largest such decline you've experienced during a given timeframe. Your current drawdown resets to zero each time you reach a new equity peak, but max drawdown preserves your worst historical decline as a benchmark.
Important: Mantis is a trading journal and analytics tool. This page is not investment advice, not financial advice, and not a recommendation to buy or sell any security or instrument. Trading involves risk; past performance does not guarantee future results. Consult a qualified professional before making financial decisions.