Log initial risk and exit for instant R calculation
Mantis captures your entry price, stop-loss, and exit level so every trade automatically converts into R-multiple—no spreadsheet formulas or manual math required.
Your R-multiple tells you how many times your initial risk you made or lost on each trade—turning every outcome into a standardized, comparable unit. By tracking R-multiple in your trading journal, you shift focus from arbitrary dollar amounts to consistent risk-reward execution, making it easier to spot which setups deliver multiples of your risk and which drain your account. A disciplined journal that captures R-multiple for every trade reveals your true edge, highlights behavioral patterns, and shows whether you're executing your plan or chasing random profits.
New to R-multiple? Read the definition, formula & example →
Opens the App Store
Mantis captures your entry price, stop-loss, and exit level so every trade automatically converts into R-multiple—no spreadsheet formulas or manual math required.
Whether you risked $50 or $500, R-multiple normalizes results so you can identify which strategies and setups consistently deliver positive multiples across different position sizes.
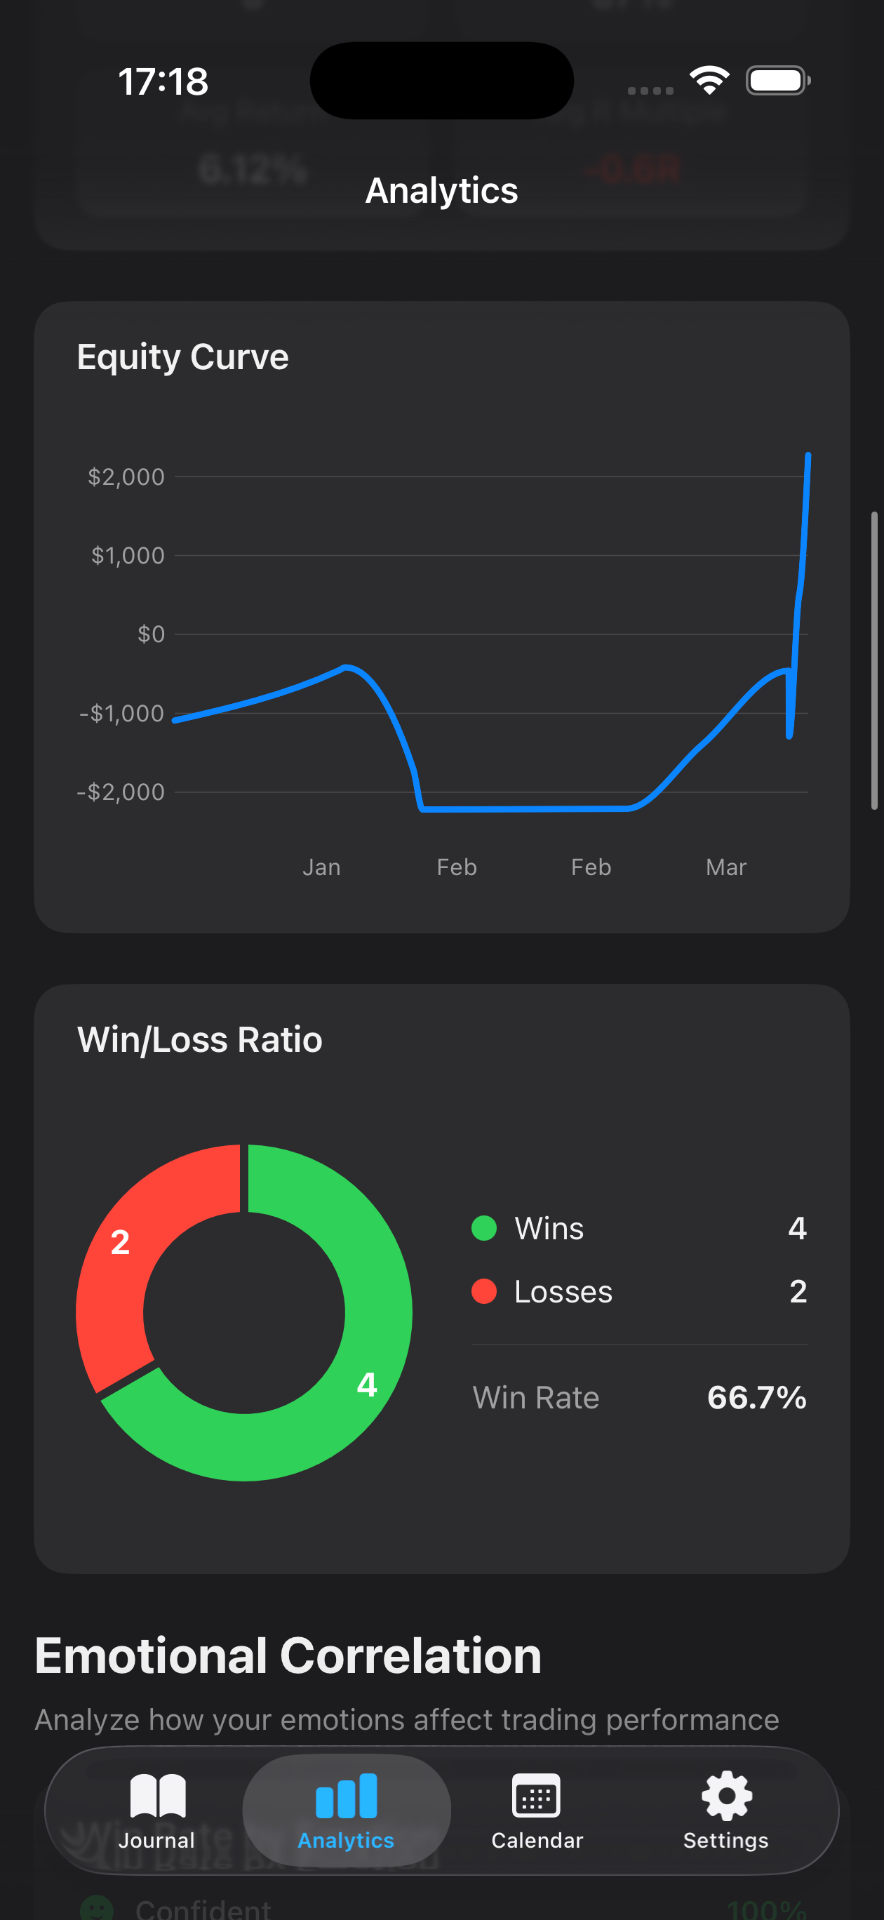
See your cumulative R curve over time to understand whether you're compounding gains through disciplined exits or giving back profits with inconsistent risk management.
Tag trades by pattern or timeframe, then sort by R-multiple to discover which conditions produce your best risk-reward outcomes and deserve more capital allocation.
All your R-multiple history lives locally on your iPhone—no cloud sync, no external servers—so your performance data and risk metrics stay completely private.
R-multiple expresses profit or loss as a ratio of your initial risk per trade. If you risked $100 (distance from entry to stop) and made $200, that's +2R. If you lost $50, that's –0.5R. It standardizes results so you can compare every trade on the same scale.
Dollar amounts vary with position size and account balance, making it hard to compare a $1,000 win on a large position to a $100 win on a small one. R-multiple shows whether you're consistently capturing multiples of your risk—the true measure of execution quality.
Many traders review weekly or after every ten trades to spot trends—like frequent small losses (–1R exits) or rare large wins (+3R or more). Regular review in your journal helps you recognize whether you're following your plan or cutting winners too early.
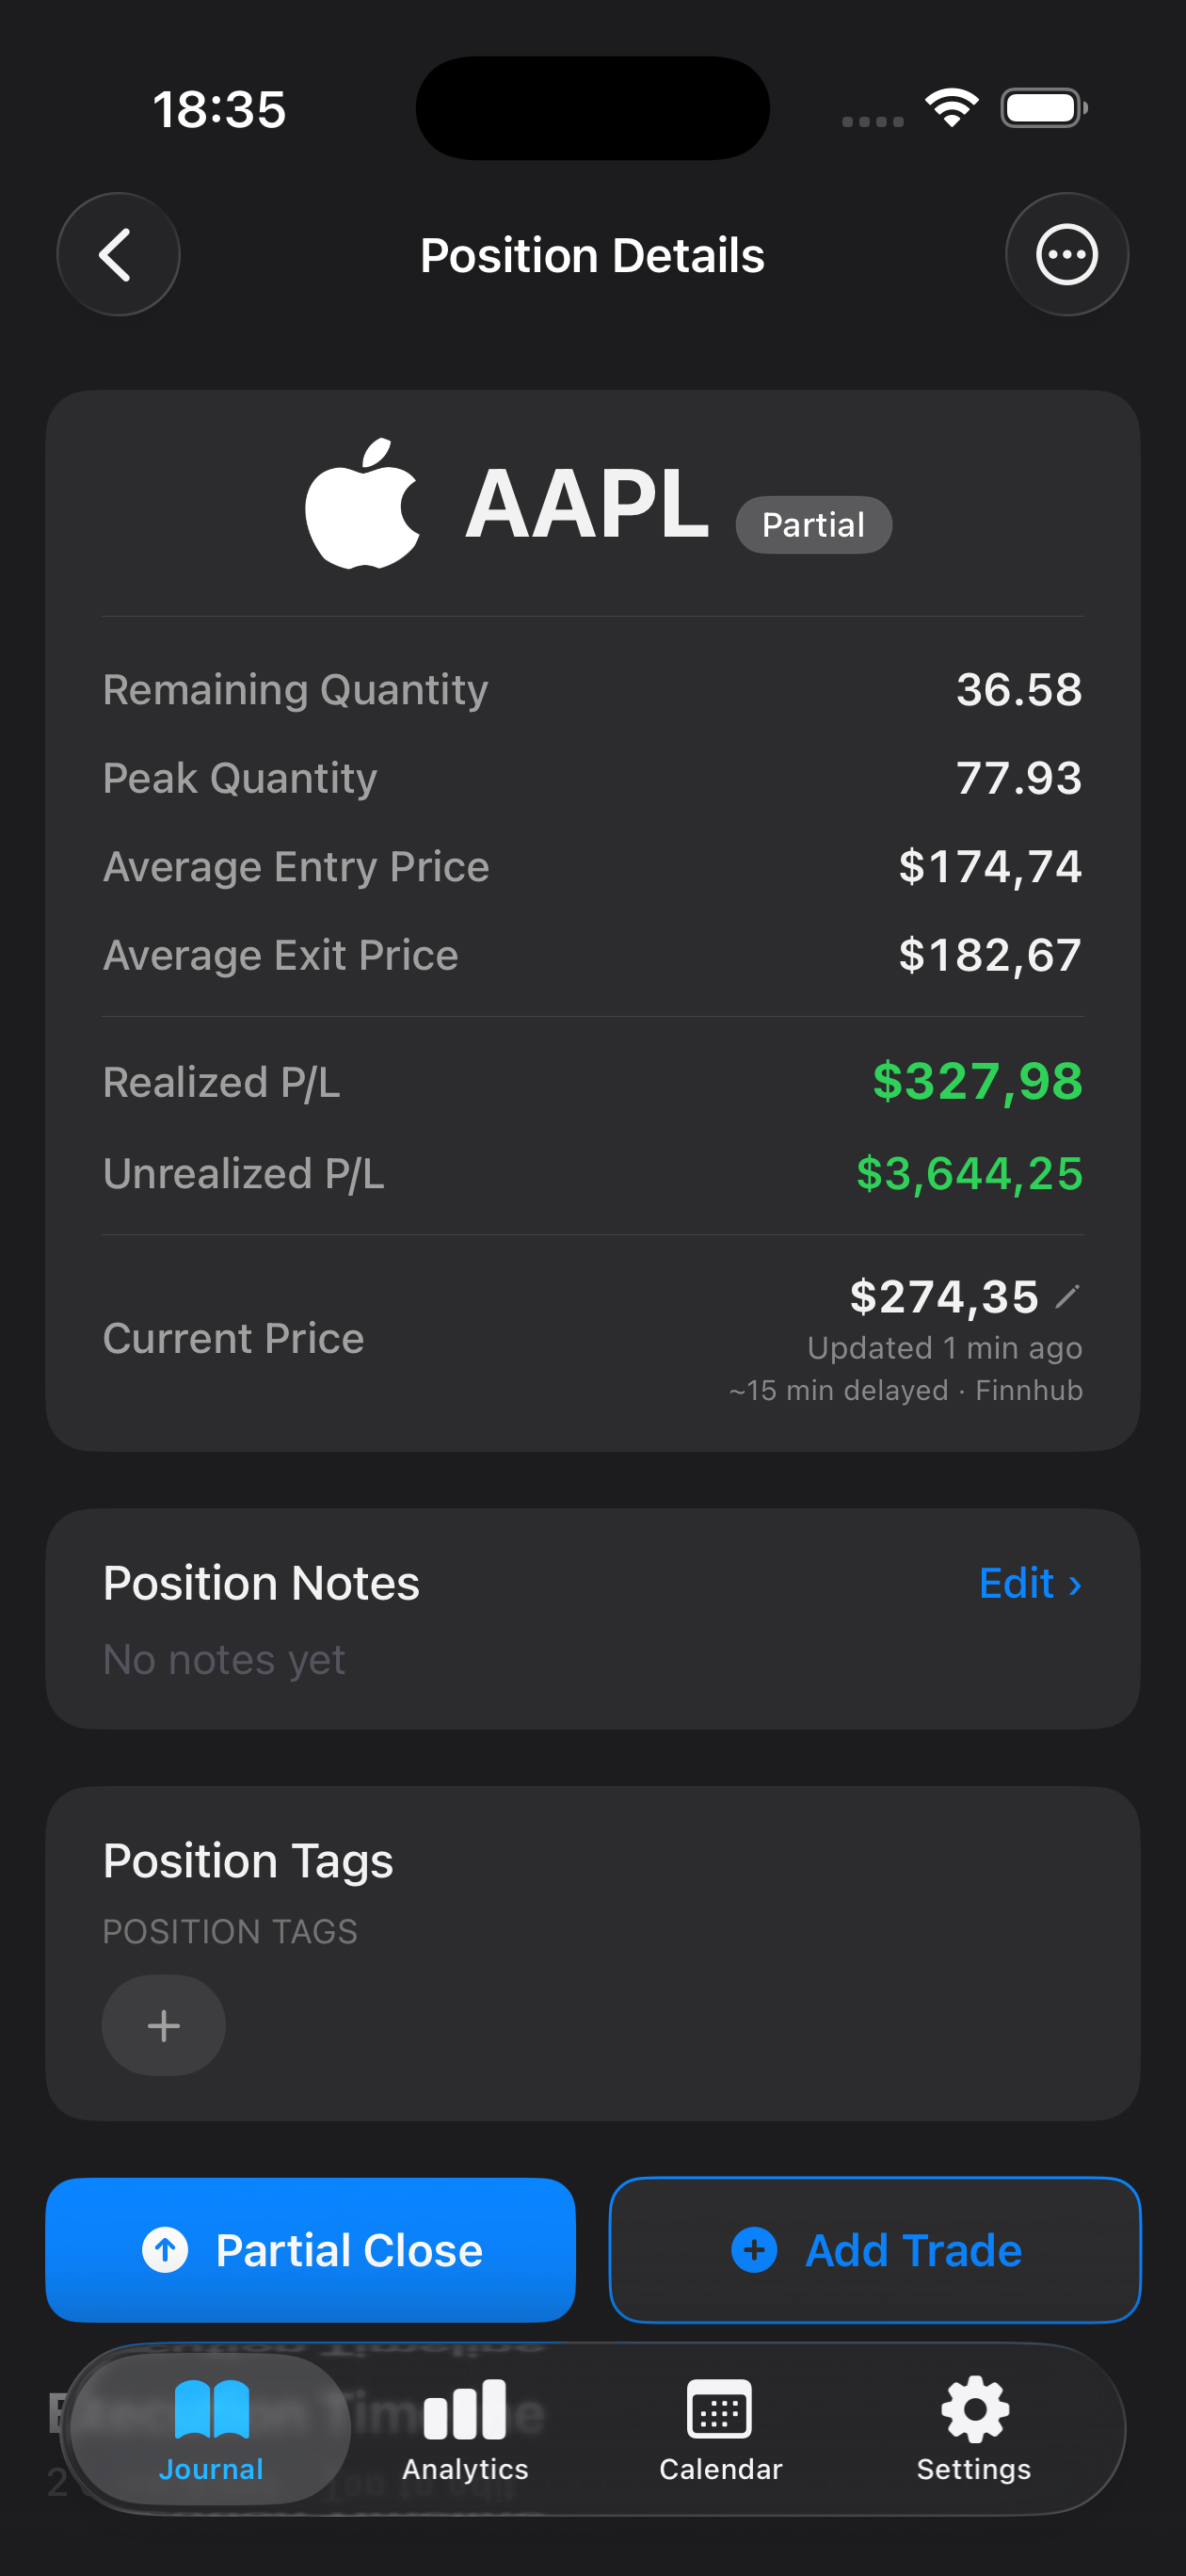
Yes. Log each partial exit as a separate line in your journal with its own R calculation, or average the R across all exit tranches. Mantis lets you record multiple exits so you can see the blended R-multiple for complex trade management.
No. Mantis stores all trade data—including R-multiple, entry, stop, and exit levels—locally on your device only. There is no cloud sync or backup, ensuring your risk metrics and performance history remain completely private.
Important: Mantis is a trading journal and analytics tool. This page is not investment advice, not financial advice, and not a recommendation to buy or sell any security or instrument. Trading involves risk; past performance does not guarantee future results. Consult a qualified professional before making financial decisions.