Is a smaller max drawdown always better?
Generally yes, because smaller drawdowns mean less pain and faster recovery, but context matters. A strategy with −10% max drawdown and 5% annual return may be less attractive than one with −25% drawdown and 30% return, depending on your goals. The key is whether the drawdown is proportionate to the potential reward and whether you can psychologically and financially withstand it.
How is max drawdown different from a losing trade?
A losing trade is a single position that closes at a loss. Max drawdown measures the cumulative decline from your account's highest point to its lowest point, which can span multiple trades and days or weeks. You might have several small winning trades during a drawdown period, but if losses outweigh wins, your account still declines from its peak.
Can max drawdown happen even if I'm profitable overall?
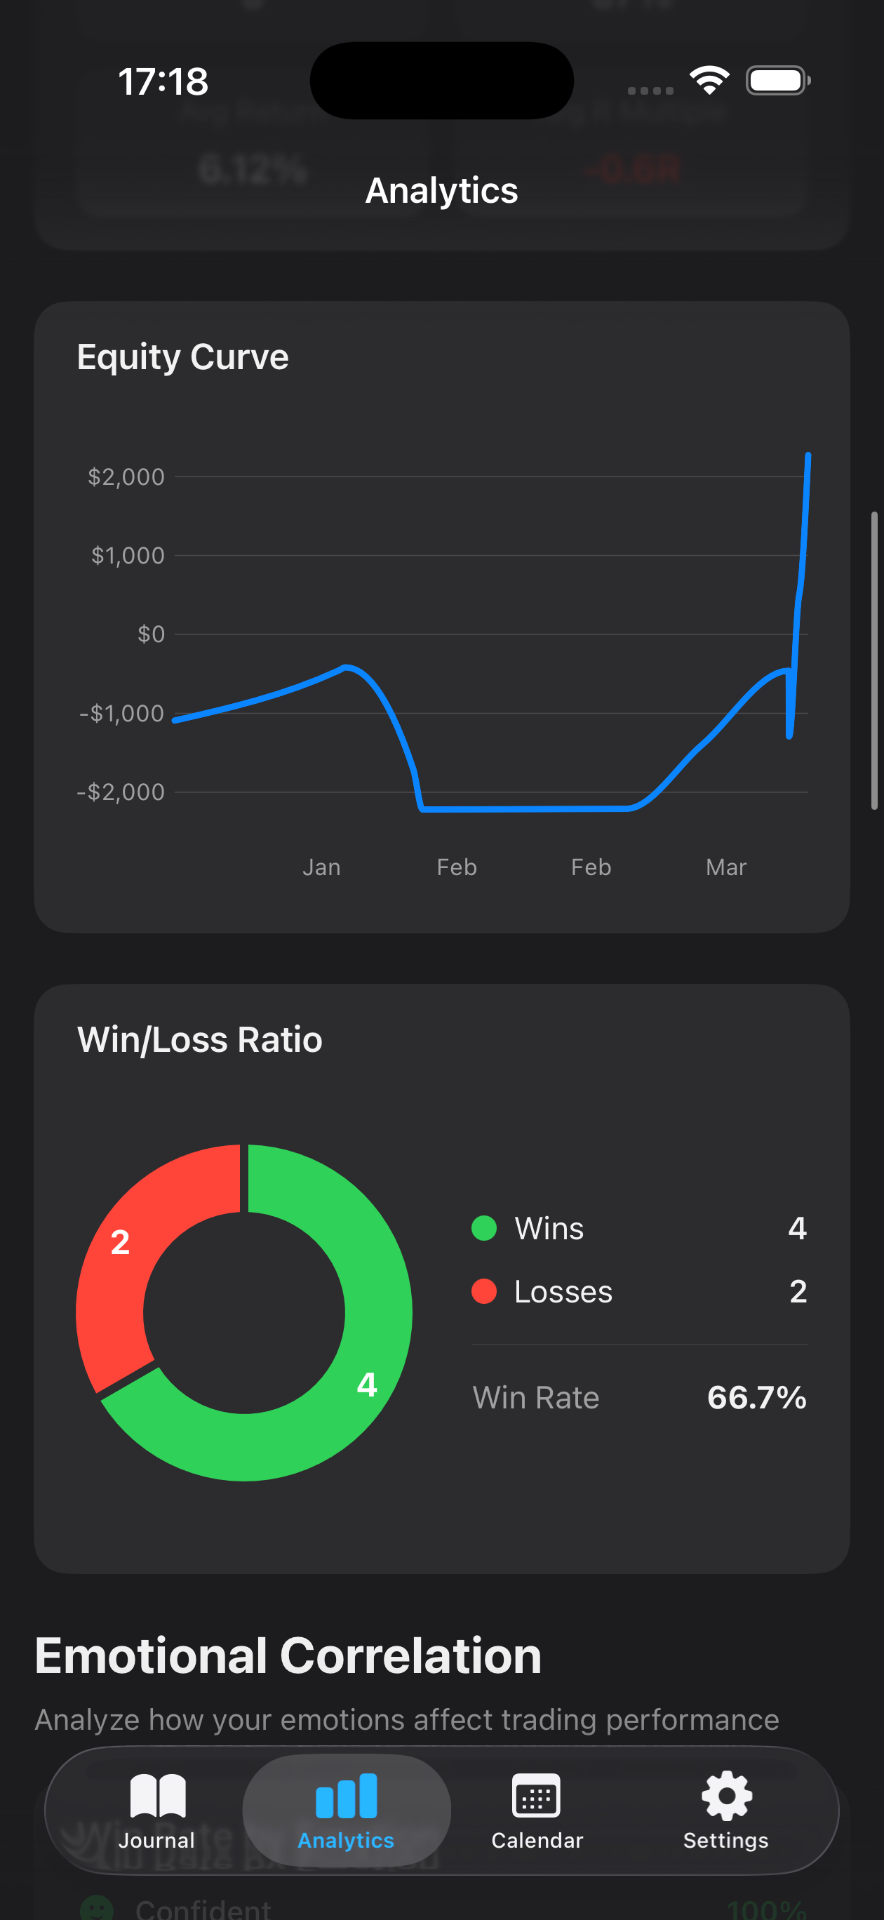
Absolutely. Max drawdown measures the worst peak-to-trough decline during a period, not your total profit or loss. You can finish the year up 20% but still have experienced a −30% max drawdown along the way. The drawdown captures the rough patch you had to survive before your account recovered and climbed higher.
What's the difference between max drawdown and average drawdown?
Max drawdown is the single largest peak-to-trough loss over a period—your worst-case scenario. Average drawdown is the mean of all drawdown periods, giving you a sense of typical declines. Max drawdown is more important for risk management because it shows the extreme stress your account and discipline must endure, while average drawdown indicates everyday volatility.
How long does it take to recover from a max drawdown?
Recovery time varies widely depending on your strategy's win rate, position sizing, and market conditions. A −20% drawdown requires a 25% gain to break even, while a −50% drawdown needs a 100% gain. Some traders recover in weeks; others take months or never fully recover. Tracking drawdown duration alongside the percentage helps you understand both the depth and length of your rough patches.
What is a good max drawdown?
There is no universal number. Conservative systematic strategies often try to keep max drawdown under about 20%, while more aggressive styles may live with 30–40%. A good max drawdown is one you can sit through without abandoning the plan, and one whose recovery math you have already run: a 50% hole needs a 100% gain just to get back to even.