Automatic P&L Calculation
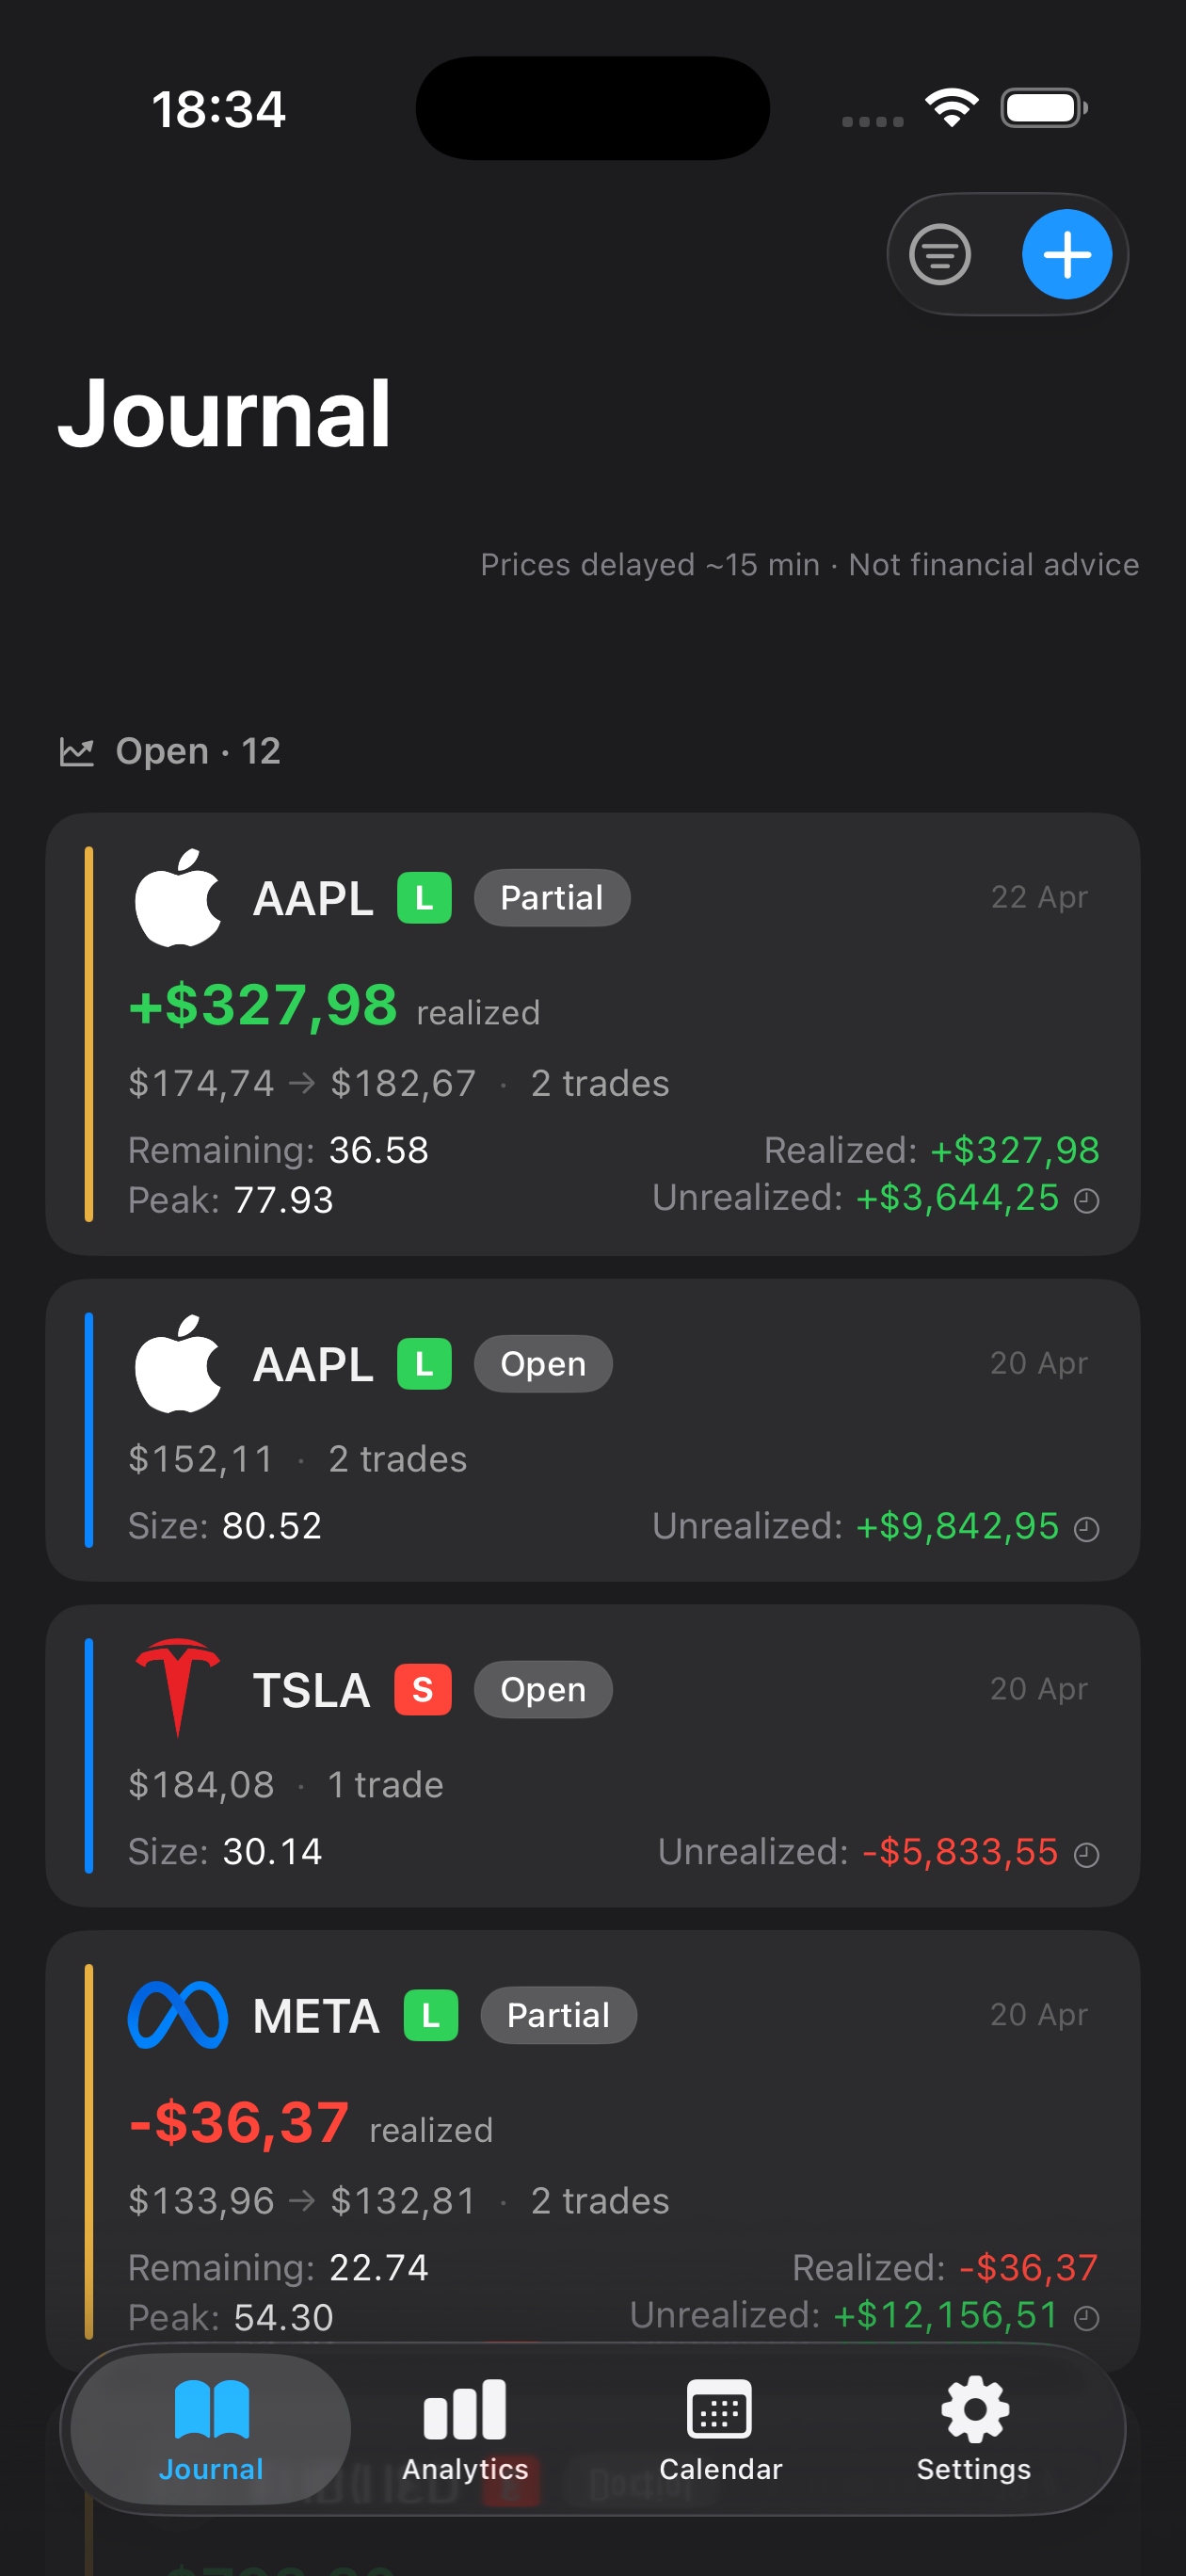
Log your entry price and exit price once; Mantis calculates profit and loss instantly. No manual math means no errors, so your average win/loss data stays accurate for genuine reflection.
Understanding your average win and loss is one of the most revealing metrics in trading. While many traders focus on win rate alone, knowing the size of your wins versus losses reveals whether your strategy truly rewards risk-taking. A journal that automatically captures trade entry, exit, and P&L lets you spot patterns: Are your wins too small? Are your losses running too large? Tracking this metric consistently helps you refine position sizing and exit discipline—core elements of any repeatable trading process.
Opens the App Store
Log your entry price and exit price once; Mantis calculates profit and loss instantly. No manual math means no errors, so your average win/loss data stays accurate for genuine reflection.
Label trades by strategy, asset, or market condition. Filter your journal to review average win/loss for specific subsets—see how your performance varies across different trading approaches.
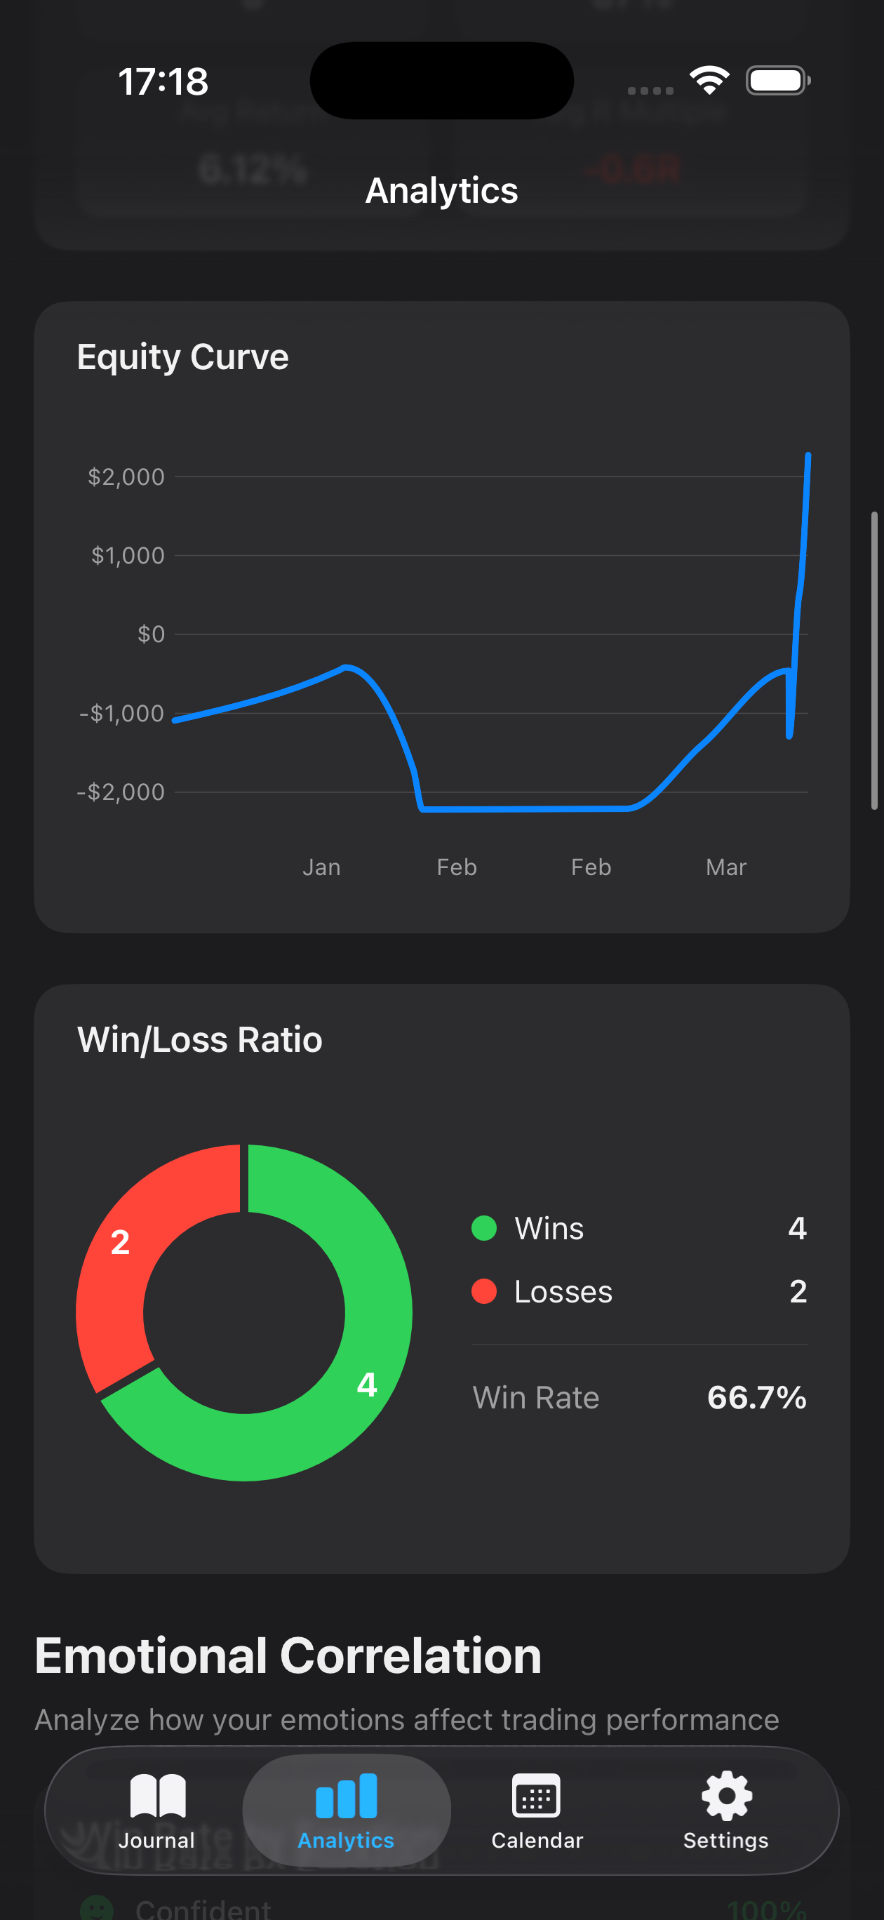
View aggregate metrics including total wins, total losses, and averages at a glance. Watch these numbers change over time to identify whether your trading discipline is improving.
Every trade is stored securely on your device with no cloud dependency. Your journal remains private and always accessible, encouraging daily review and honest record-keeping.
Scroll through past entries and compare month-to-month or quarter-to-quarter trends. Spot whether your average win/loss ratio improves as you refine your process.
Average win is the mean profit across all winning trades; average loss is the mean loss across all losing trades. Together, they show whether your winners outpace your losers in size. For example, an average win of $200 with an average loss of $100 suggests favorable risk-reward, while the opposite suggests you may need to tighten exits or reposition sizing.
Review weekly or after every 10–20 trades, whichever comes first. Regular review helps you spot trends early—like whether losses are creeping larger or whether you're booking profits too early. Consistency matters more than frequency.
A trader with a 40% win rate but large average wins can be profitable; a trader with an 80% win rate but tiny average wins may not be. The ratio of win size to loss size is often a stronger predictor of long-term success than simply counting wins. A good journal captures both numbers so you see the full picture.
Yes, if possible. Some strategies or market conditions may yield different win/loss profiles. Mantis lets you tag and filter trades, so you can compare your average win/loss across different setups—revealing which approaches truly suit your edge.
Log every trade promptly and consistently. Use the same entry/exit rules and note the criteria you used to exit. Skipping trades or editing entries retroactively distorts your metrics. Mantis stores data locally on your device, so your journal stays secure and easy to maintain.
Important: Mantis is a trading journal and analytics tool. This page is not investment advice, not financial advice, and not a recommendation to buy or sell any security or instrument. Trading involves risk; past performance does not guarantee future results. Consult a qualified professional before making financial decisions.