iOS trading journal Download
← Trading terms glossary

What Is Recovery Factor in Trading?

Recovery factor in trading is net profit ÷ your worst drawdown: profit divided by the deepest peak-to-trough hole on the equity curve. Traders check it to see if profit covered that hole, when the result looks profitable and the path was painful. The figure describes the sample already in the journal, not the next one.

Run your own numbers in the drawdown recovery calculator. The denominator is max drawdown.

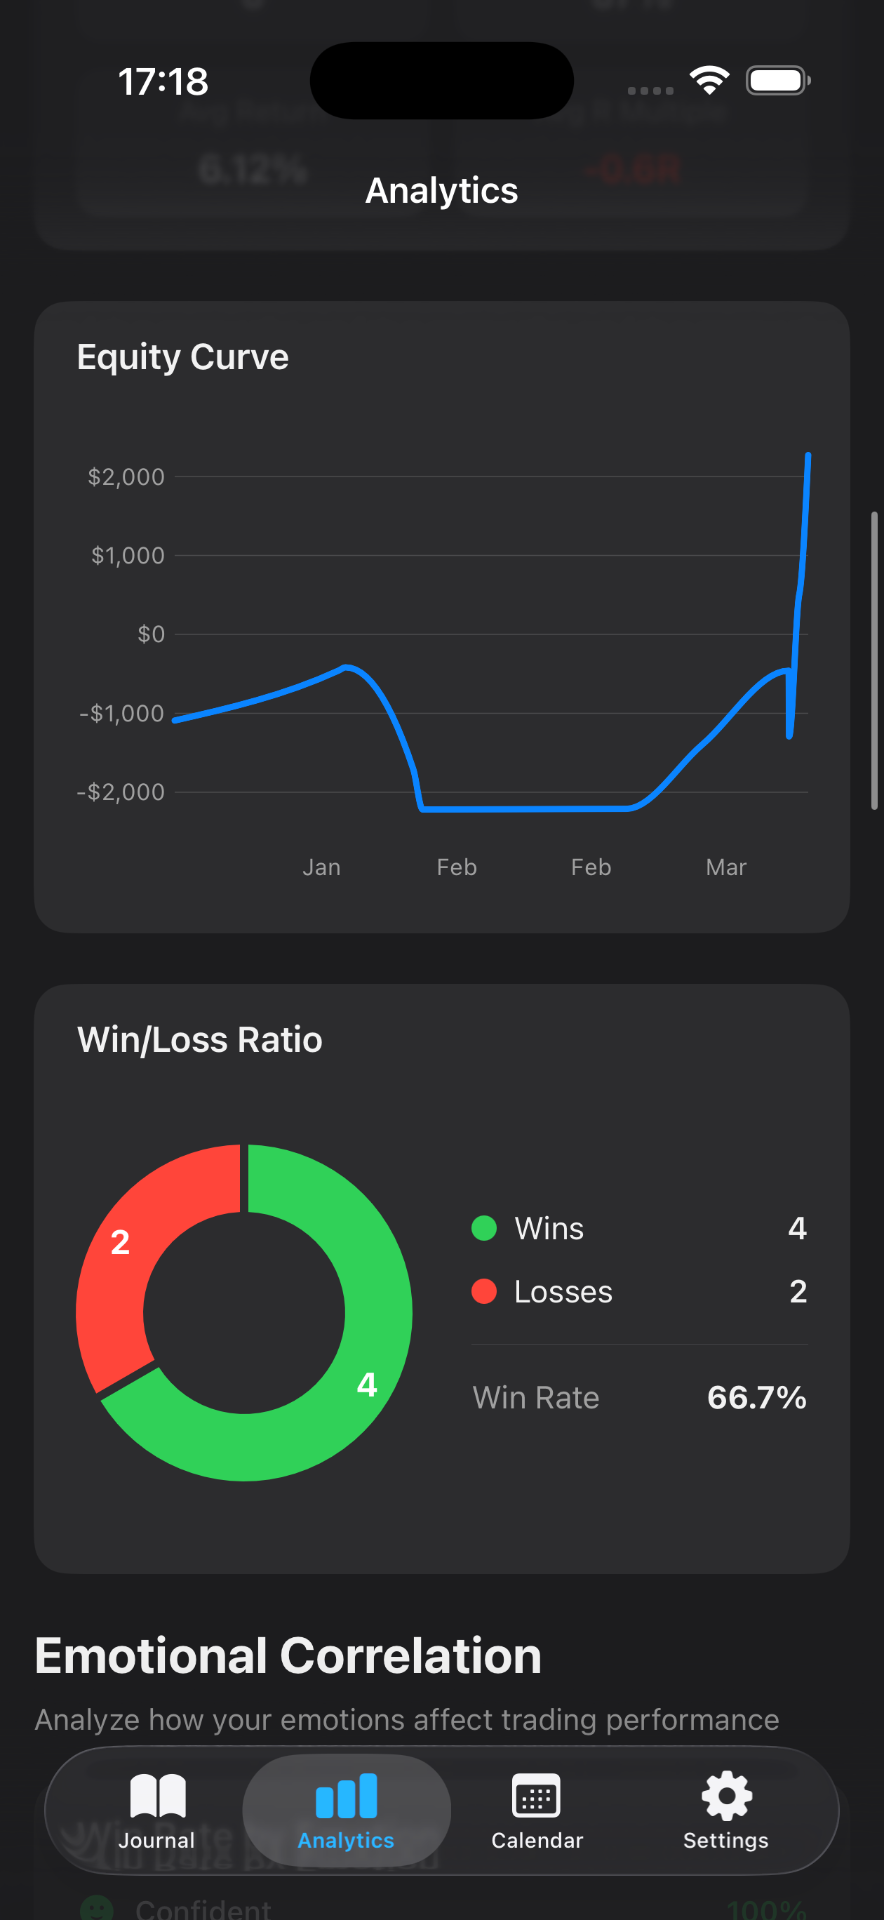
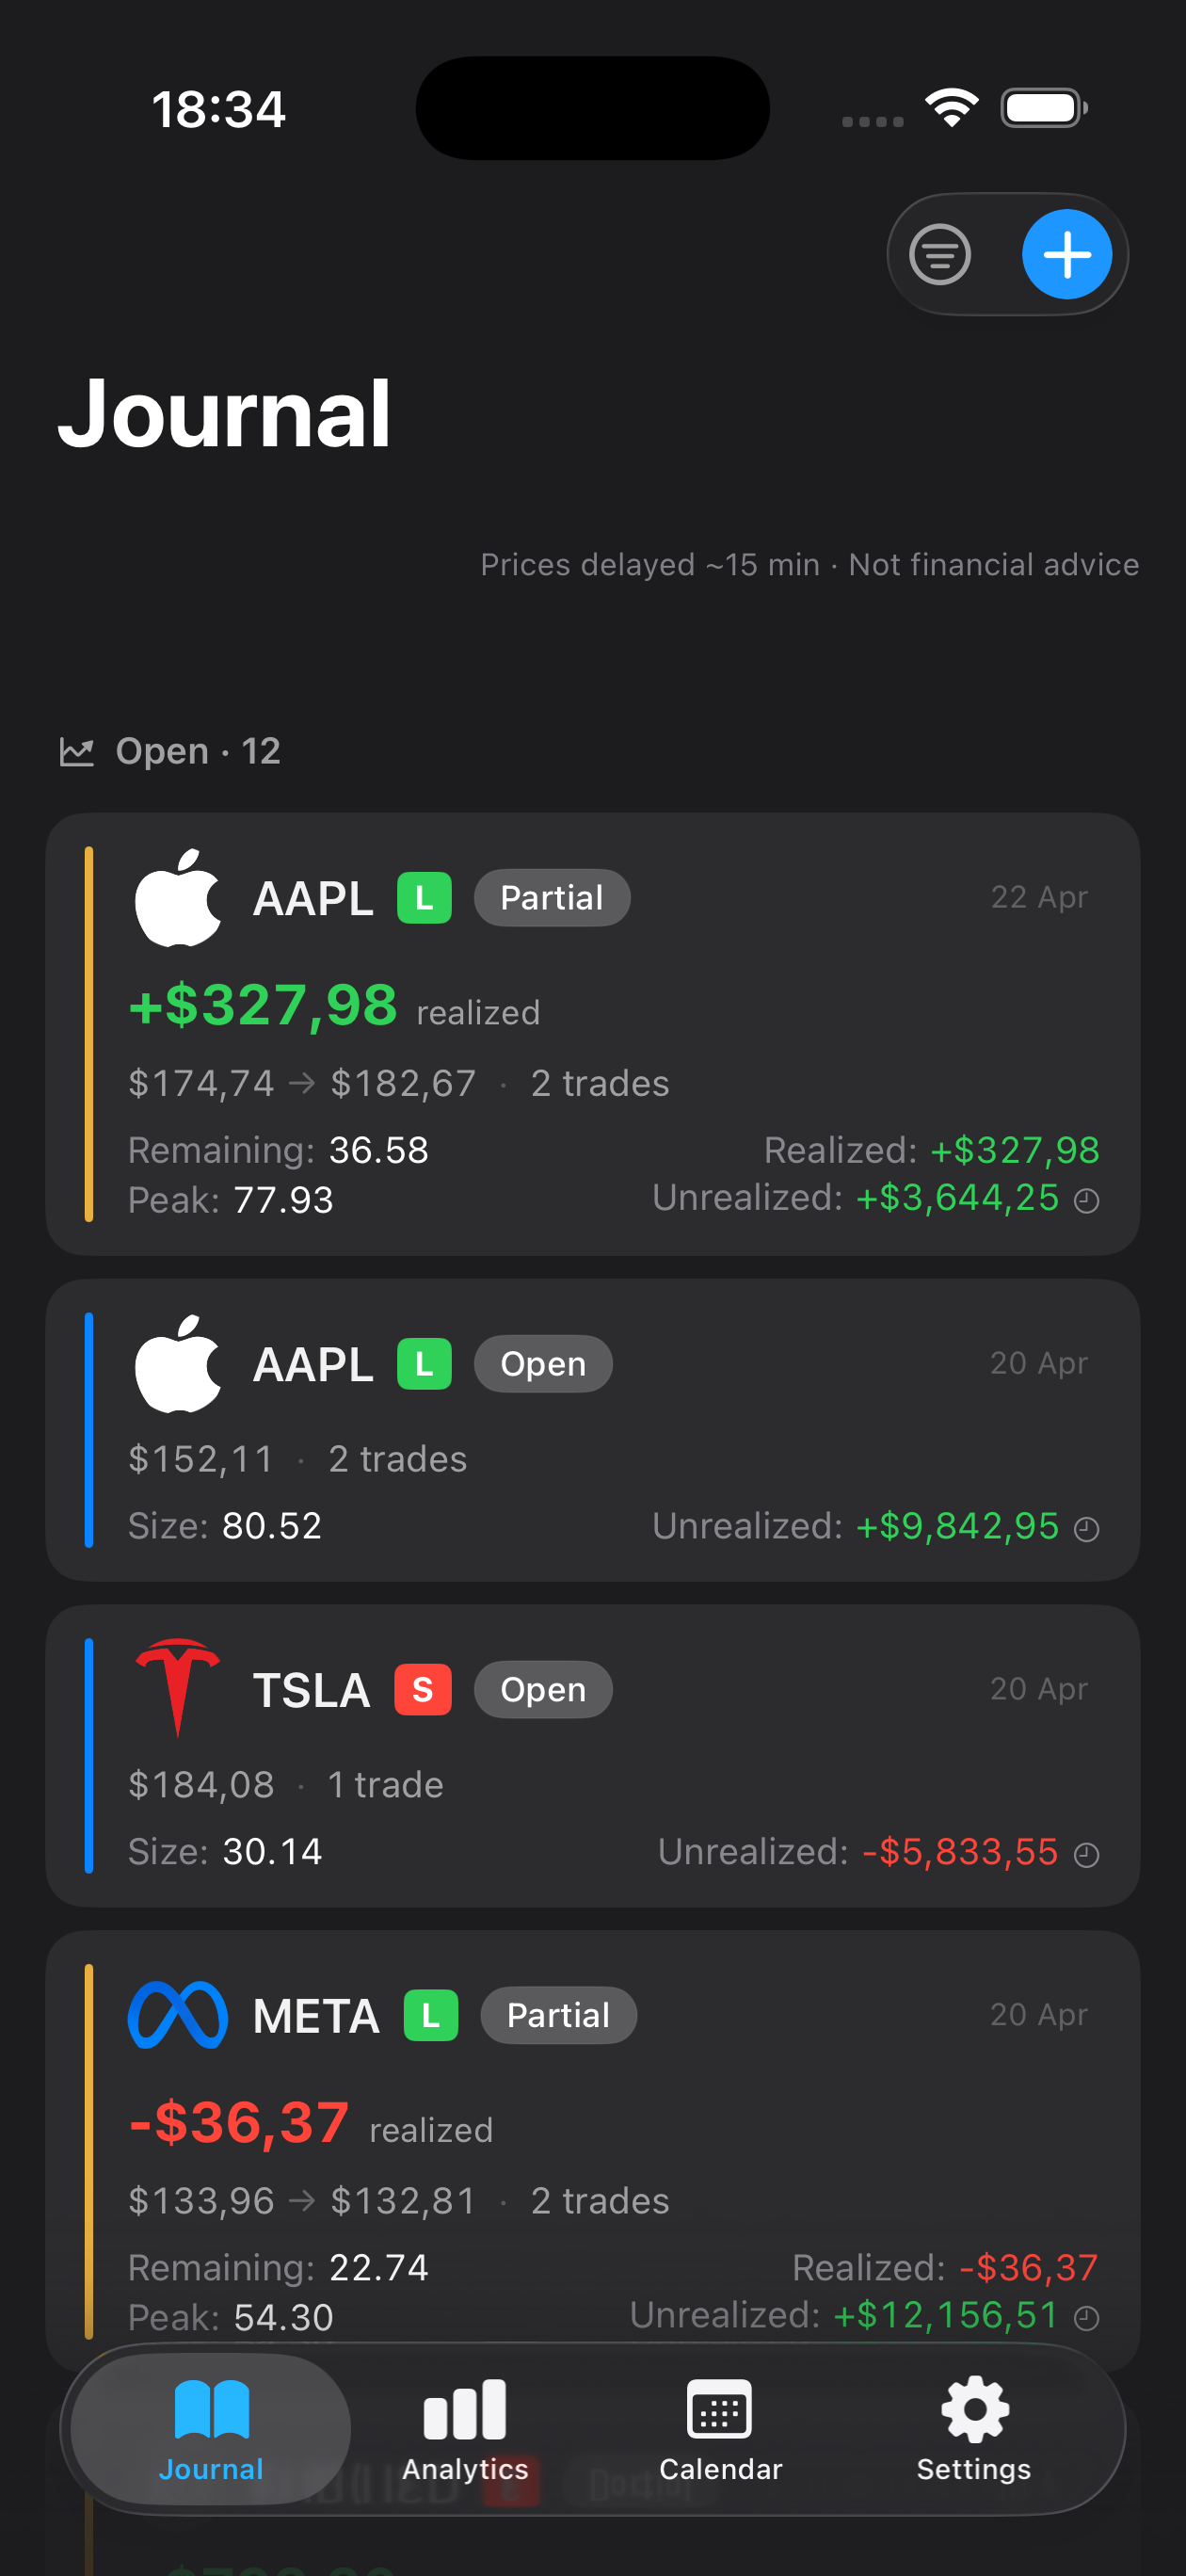
Mantis equity curve and win/loss charts used to review recovery factor performance Mantis trading journal on iPhone — the trade log Mantis uses to calculate recovery factor

In a nutshell

The formula

Recovery factor = net profit ÷ |maximum drawdown|. Use the same unit on both sides, almost always account currency, not a mix of dollars and percent. Worked example: $12,000 of net profit and a deepest peak-to-trough drop of $4,000 is 12,000 ÷ 4,000 = 3.0, so net profit was three times that worst hole. If max drawdown is stored as a percentage, convert it to currency (peak equity × that percentage) before you divide.

How to read it

Compare net profit with the worst drawdown in the same units. Above 0, the sample finished in profit. Above 1, that profit was larger than the worst hole. Between 0 and 1, the hole was larger than the profit. Below 0, the book lost money over the sample. Those thresholds describe that sample. A short journal can print a flattering ratio before a real losing streak shows up, and a long journal can lift the ratio because profit kept accumulating against one old hole. Calmar ratio annualizes return before a similar division; recovery factor uses total net profit, and a one-week crash scores the same as a year-long grind when the currency depth matches. Read it beside drawdown size, profit factor, and how long the hole lasted.

Why it matters

Win rate and profit factor can look healthy while one sequence carved a deep hole in the account. Recovery factor puts that hole in the denominator, so you can see whether the profit covered the worst stretch in the sample. What it leaves out is time. Two books with the same dollar drawdown and the same net profit share the same recovery factor even when one climbed back in a week and the other took a year. Use the number to describe the path already taken.

Mantis is a local-first trading journal for iPhone. No account required. It tracks your P/L and max drawdown on your device, so the two numbers this formula needs are already in your journal.

Download on theApp Store

Opens the App Store

Frequently asked questions

Is a higher recovery factor always better?

A higher number means net profit covered the worst drawdown more times, which is usually preferable. A very high ratio on a tiny sample, or on a period that never saw a real losing streak, can still be fragile. Prefer a stable reading over a long journal to a spectacular reading after a handful of trades.

How is recovery factor different from Calmar ratio?

Both put drawdown in the denominator. Calmar ratio uses annualized return divided by maximum drawdown, so it is a yearly rate. Recovery factor uses total net profit over the sample, not an annualized return, so a longer profitable period can raise the number without the strategy getting safer. Use Calmar when you want a yearly comparison; use recovery factor when you want how completely the book recouped its worst hole.

Should I use dollars or percent for max drawdown?

Use the same unit as net profit. If net profit is in dollars, convert max drawdown to dollars (the peak-to-trough drop in equity). Mixing a dollar profit with a percentage drawdown produces a meaningless ratio. Mantis keeps the trade log in one currency so both sides of the formula stay aligned.

What if net profit is negative?

Then recovery factor is negative: the book lost money overall, so there is nothing to recover relative to the drawdown. A negative figure is a warning, not a ranking to optimize. Rebuild the sample after the strategy changes; do not compare a losing period's recovery factor with a later winning one as if they were the same test.

How many trades before recovery factor is meaningful?

You need enough history for a genuine peak-to-trough drawdown, not just a couple of losers. Tens of trades can sketch the formula; a few hundred, or several months of the style you actually trade, is a more honest reading. Recalculate after a new equity high or a new deepest trough, not after every single fill.
Important: Mantis is a trading journal and analytics tool. This page is not investment advice, not financial advice, and not a recommendation to buy or sell any security or instrument. Trading involves risk; past performance does not guarantee future results. Consult a qualified professional before making financial decisions.