Log every trade with entry and exit details
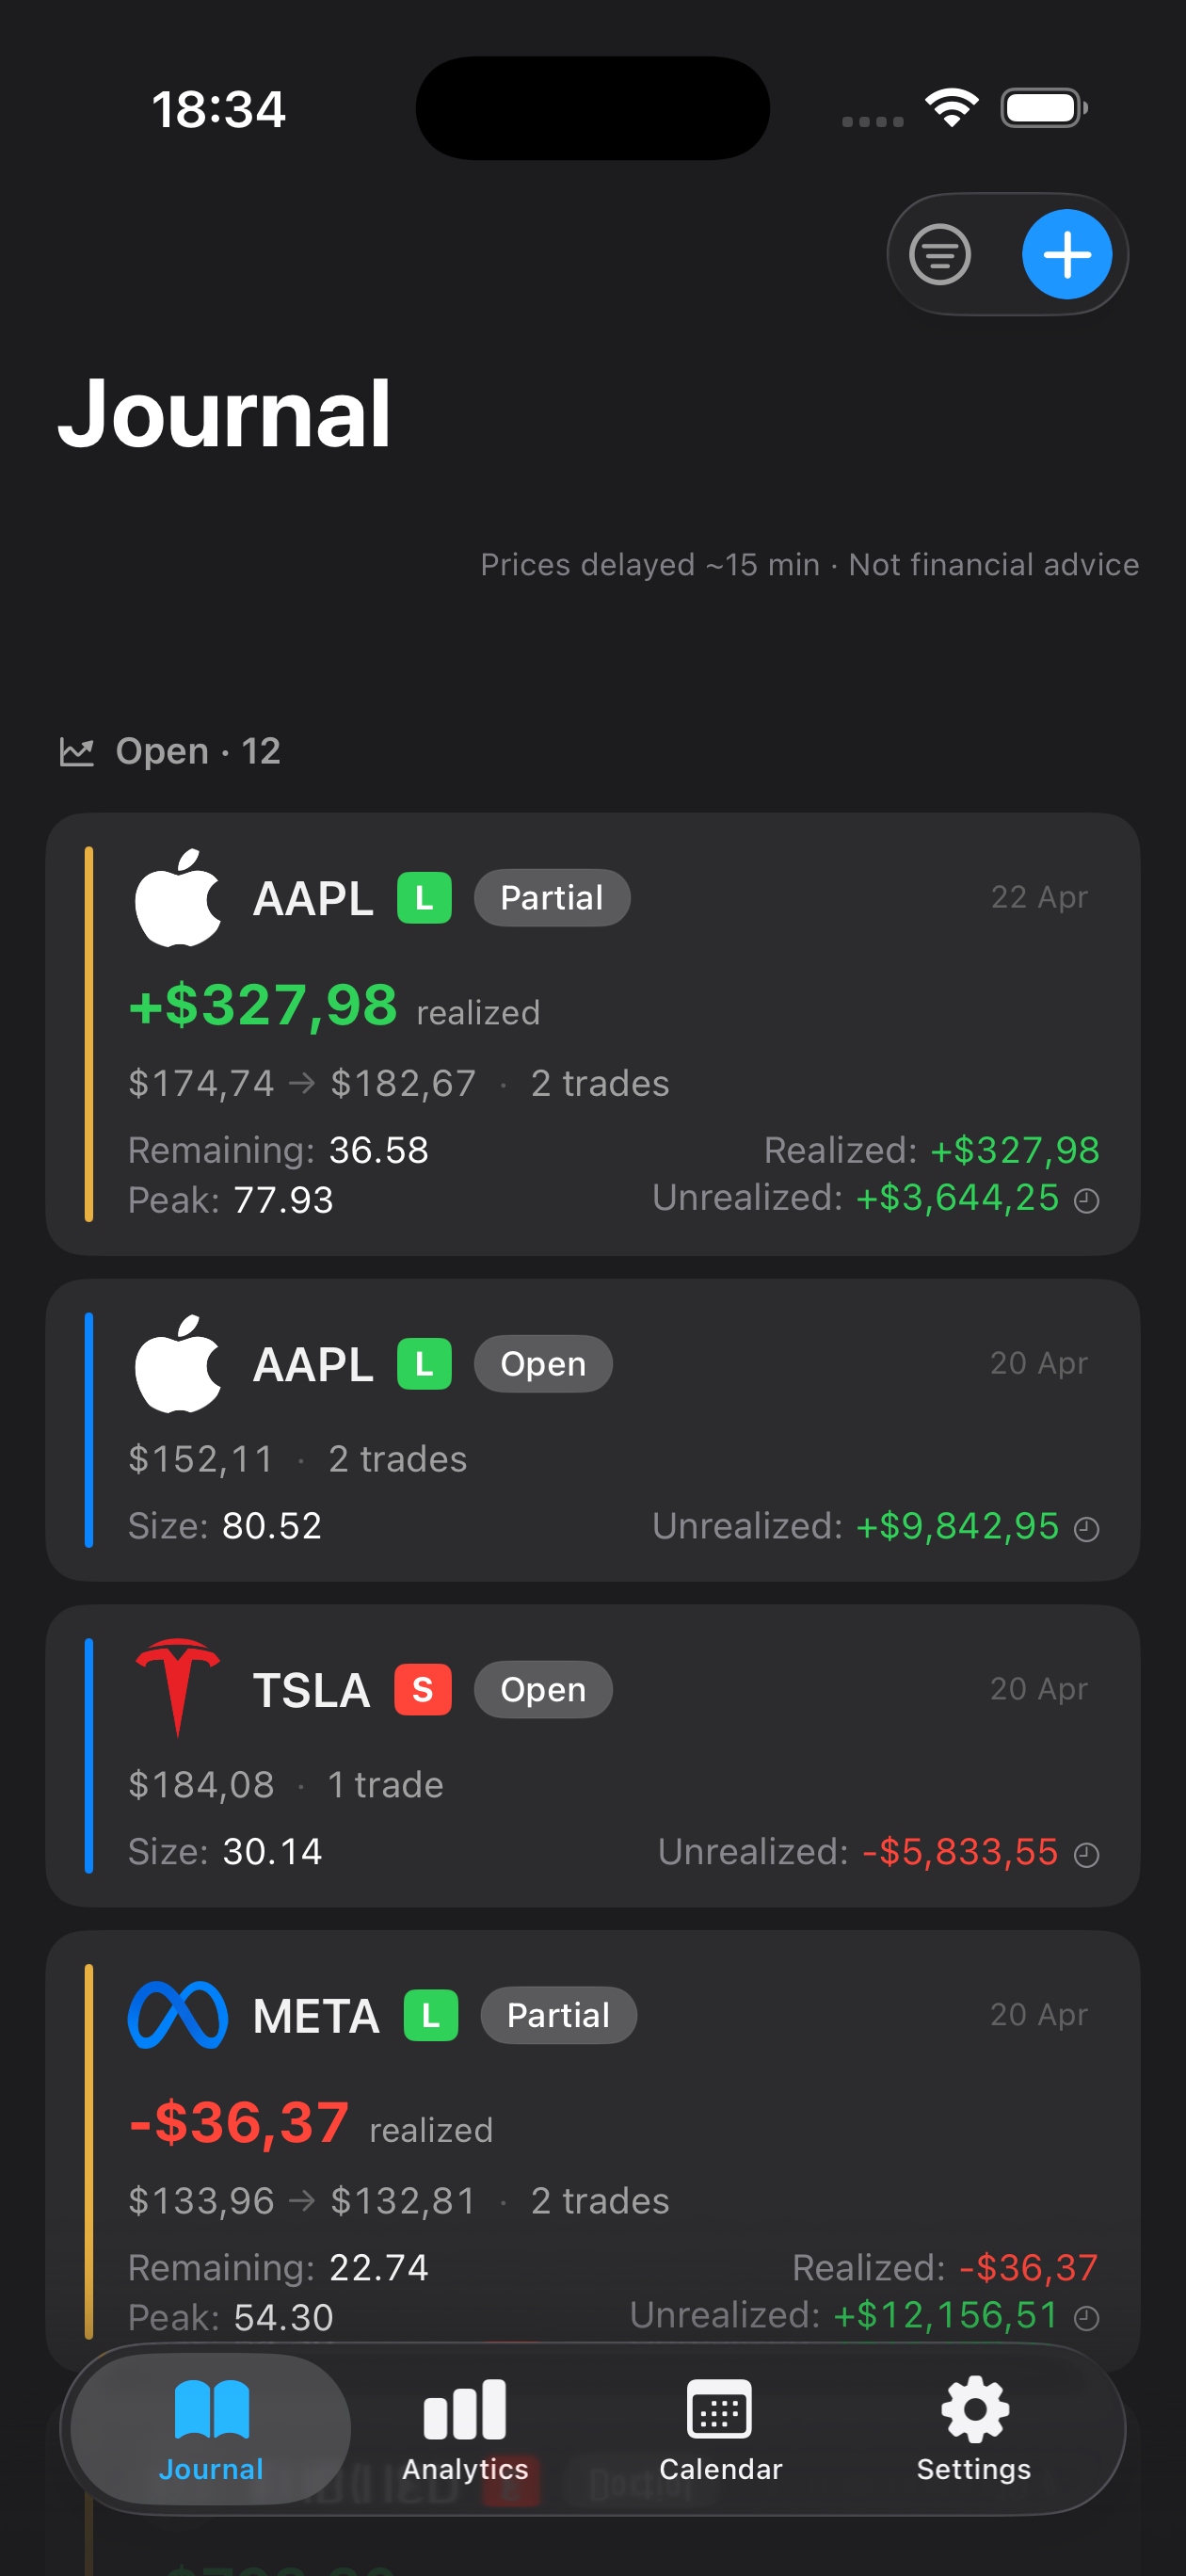
Record precise entry prices, exit prices, position size, and outcome. Mantis stores this locally on your device, giving you a complete trade history to calculate drawdowns and profits accurately.
Recovery factor is a risk-adjusted performance metric that measures how efficiently your trading strategy rebounds from drawdowns. It divides your total net profit by your maximum drawdown, revealing whether your wins are large enough to justify the largest losing streak you endured. Tracking recovery factor in a trading journal helps you understand if your approach truly compensates for risk taken, making it essential for long-term strategy evaluation rather than short-term noise.
New to recovery factor? Read the definition, formula & example →
Opens the App Store
Record precise entry prices, exit prices, position size, and outcome. Mantis stores this locally on your device, giving you a complete trade history to calculate drawdowns and profits accurately.
Maintain a cumulative P&L column in your journal. This makes it simple to identify peak equity and spot the largest peak-to-trough decline, which you need to compute recovery factor.
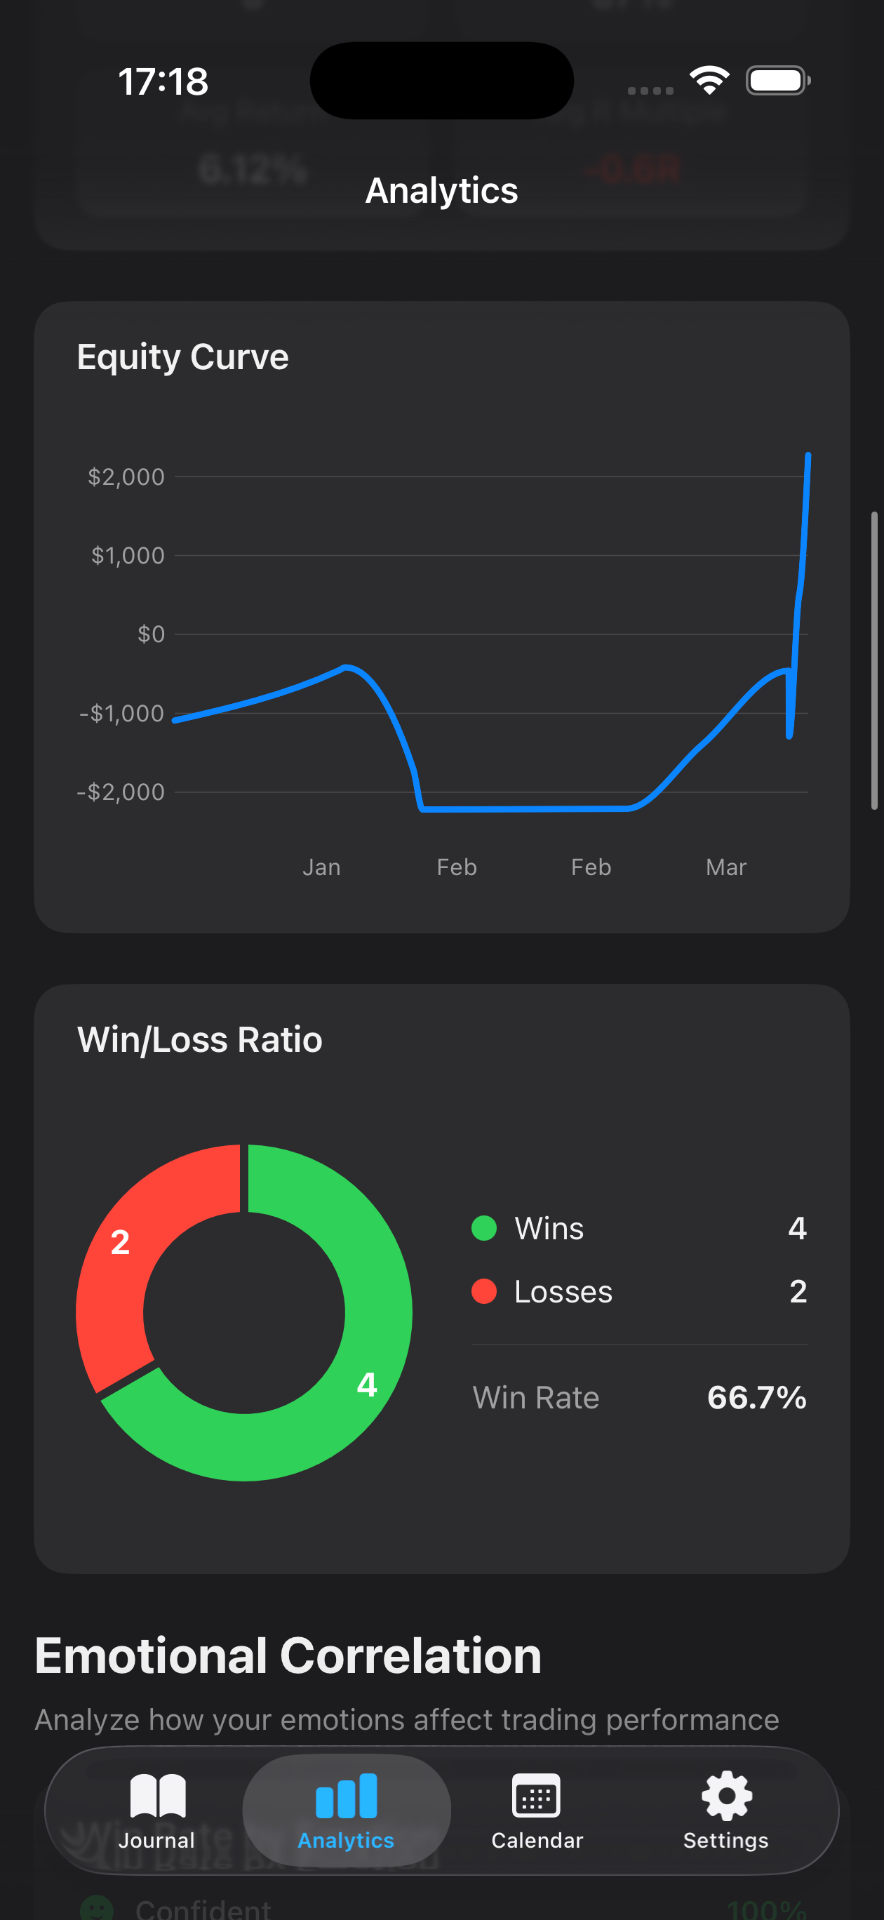
Review your equity curve over your chosen period. Find the largest percentage drop from a peak to a subsequent valley. Mantis lets you tag and organize trades by date and strategy to isolate specific analysis windows.
Once you have total net profit and maximum drawdown, divide profit by drawdown. Since Mantis keeps all data on your device only—no cloud sync required—your numbers stay private and under your control.
Compare recovery factor week-to-week or month-to-month. A journal that organizes trades chronologically helps you spot whether your strategy's resilience is improving or deteriorating.
Recovery factor divides your total profit by your maximum drawdown over a specific period. A higher recovery factor means your profits are large relative to the biggest loss streak you experienced, suggesting more efficient risk management. It's a useful metric for evaluating whether a strategy's returns justify its downside risk.
Find the largest peak-to-trough decline in your cumulative profit curve. For example, if your equity reached $10,000 and later fell to $8,000, that's a $2,000 (or 20%) drawdown. If a deeper decline happens later, use the largest one. Mantis helps organize your trade history so you can review equity progression clearly.
You can calculate it both ways. Some traders compute it for their entire trading history, while others isolate specific strategies or timeframes. Mantis lets you tag and filter trades, making it easy to segment your journal and calculate recovery factor for different approaches separately.
Most traders review recovery factor monthly or quarterly, once they have enough trade data. Calculating it too frequently (after just a few trades) can be unreliable. A consistent journaling habit in Mantis ensures you capture all necessary details to make this calculation meaningful.
Recovery factor is a historical metric that describes what already happened in your journal. It reveals patterns in how your past trades balanced profit against risk, but it does not predict future results. Use it as one tool to review your process, not to forecast outcomes.
Important: Mantis is a trading journal and analytics tool. This page is not investment advice, not financial advice, and not a recommendation to buy or sell any security or instrument. Trading involves risk; past performance does not guarantee future results. Consult a qualified professional before making financial decisions.