A P&L calendar colours each trading day by realized profit or loss, so streaks of red days and your best days stand out at a glance. In Mantis it's built from the trades you log, so there's nothing to fill in twice.
Opens the App Store
What a trading P&L calendar shows
You get one square per day you closed a trade. The number in it is realized profit or loss for that day. Green means the day made money. Red means it lost money. A day with no close stays empty.
A blotter hides the pattern. The grid does not. Losing streaks are easy to shrug off one row at a time, and hard to miss when three red Tuesdays sit in a row. The same glance shows a day you took far more trades than the days around it, and it shows which weekdays keep coming up as the ones you trade well and the ones you do not.
As a profit tracker, the square shows what the day made or lost, and nothing else. It is not a forecast, and it is not a grade of your discipline.
A trading calendar is useful only when that square is money you have already booked. Fold in open risk and a day can look finished while the position is still on.
How the P&L calendar works in Mantis
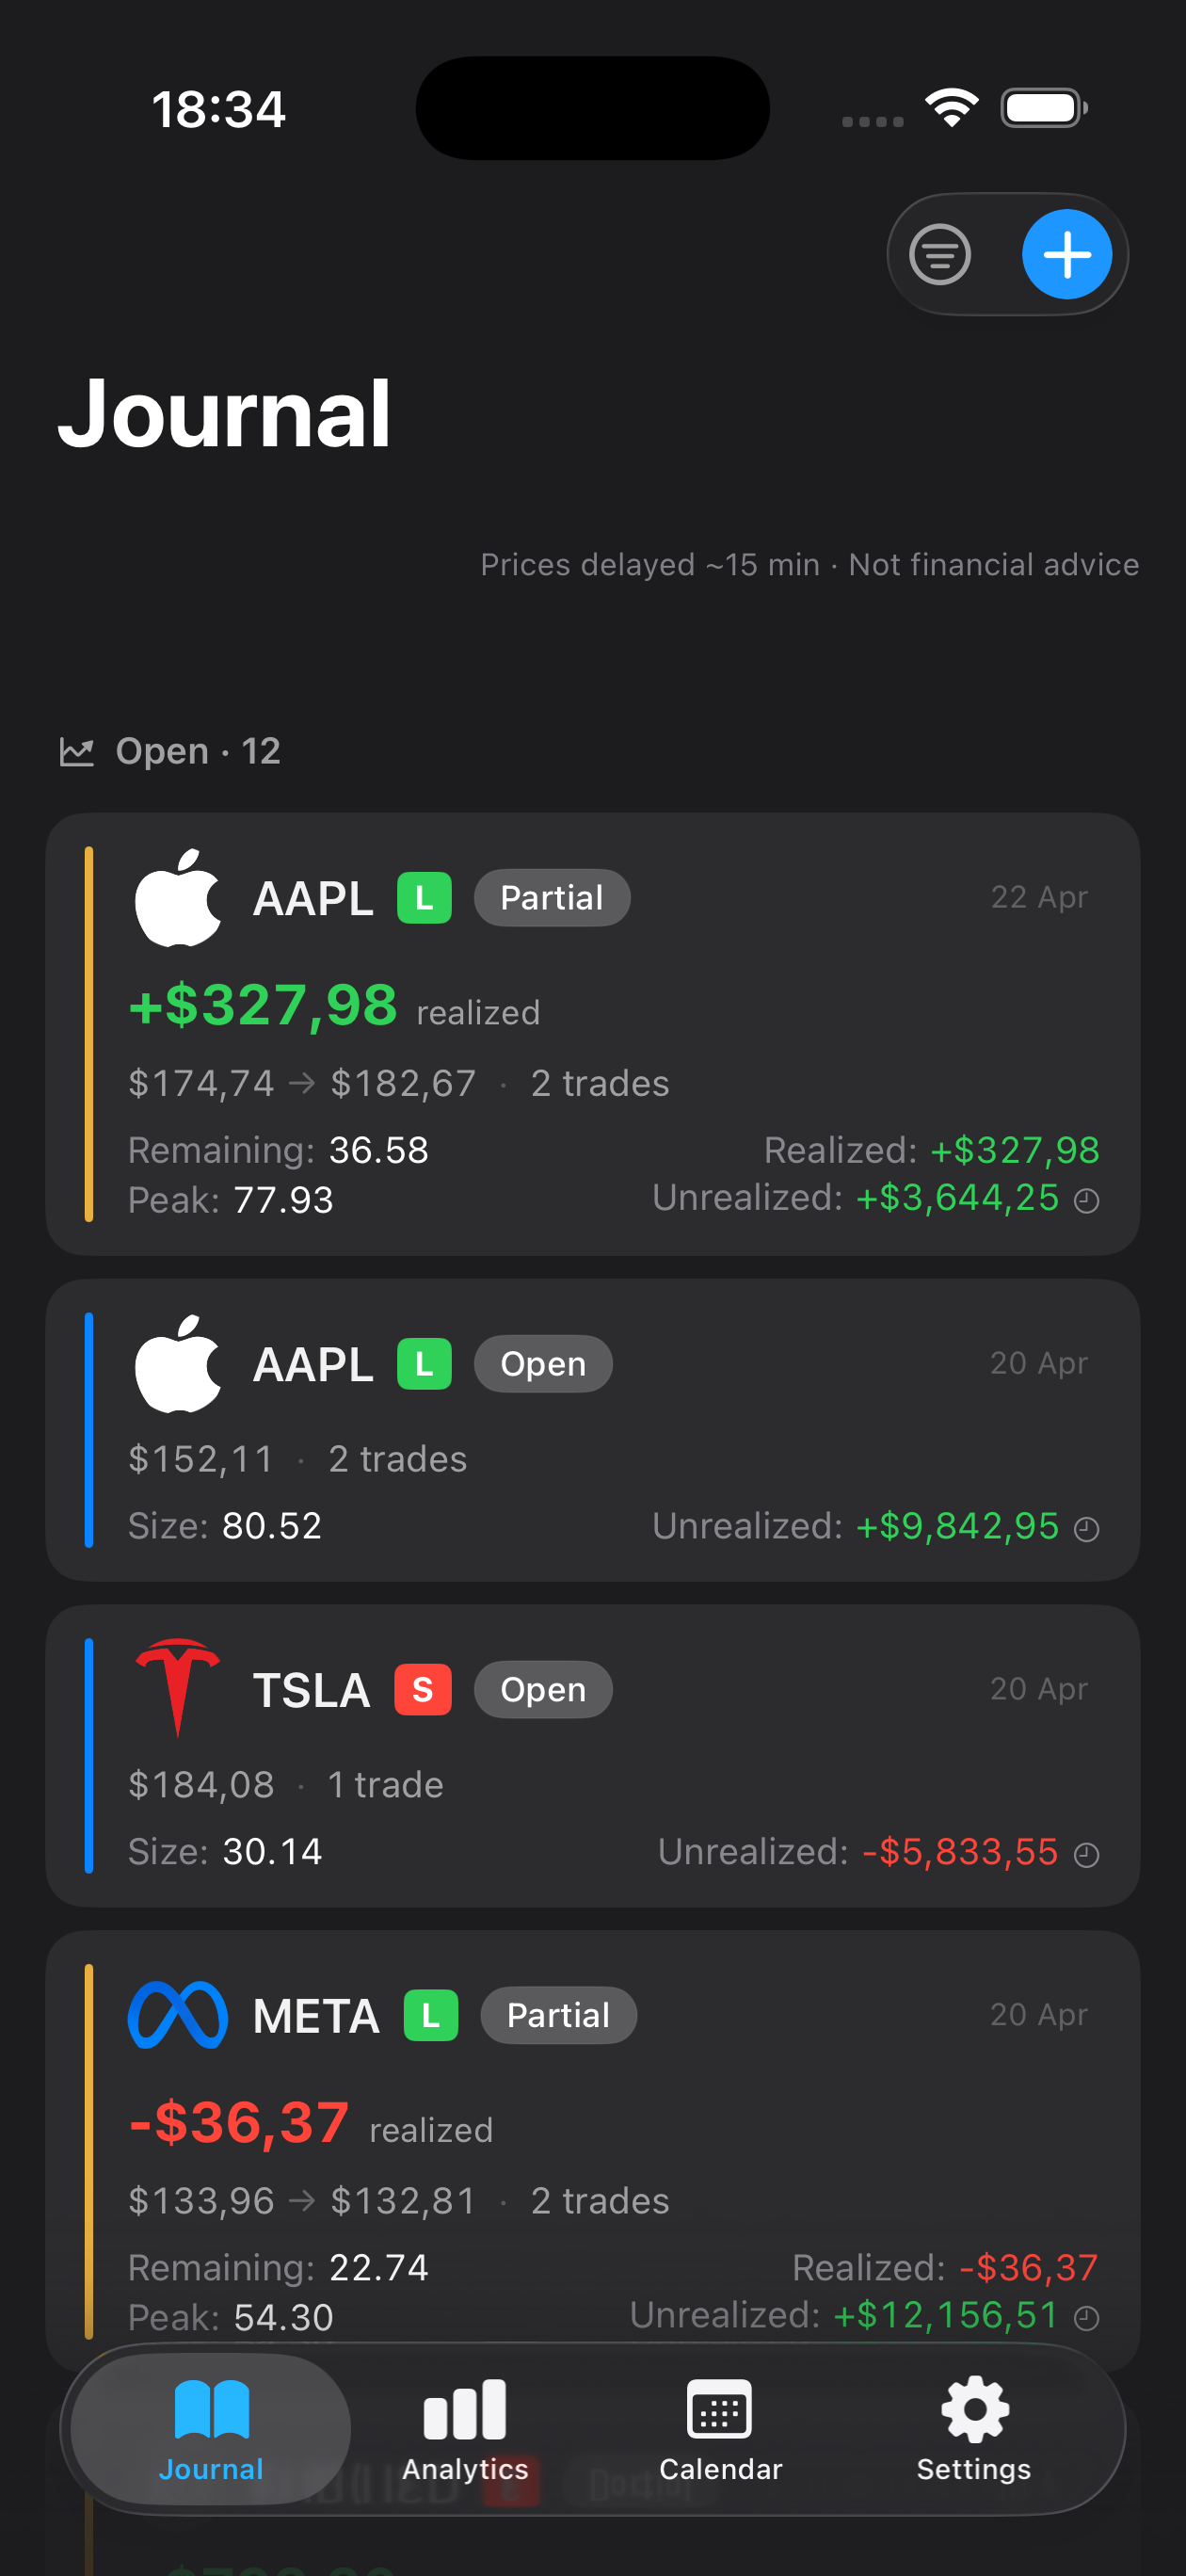
You log the position, then every execution on it. That is the entry, a scale-in, a partial close, and the full exit. A stop, a confidence level, and a note can sit on the same position. A strategy tag can too, and so can an emotion tag.
The heatmap shows realized P/L by day. It marks the best day and the worst day in the range you are looking at. Free shows this month's calendar; Premium unlocks past months. Filter by date range or by strategy tag when two styles share one account and you want only one of them.
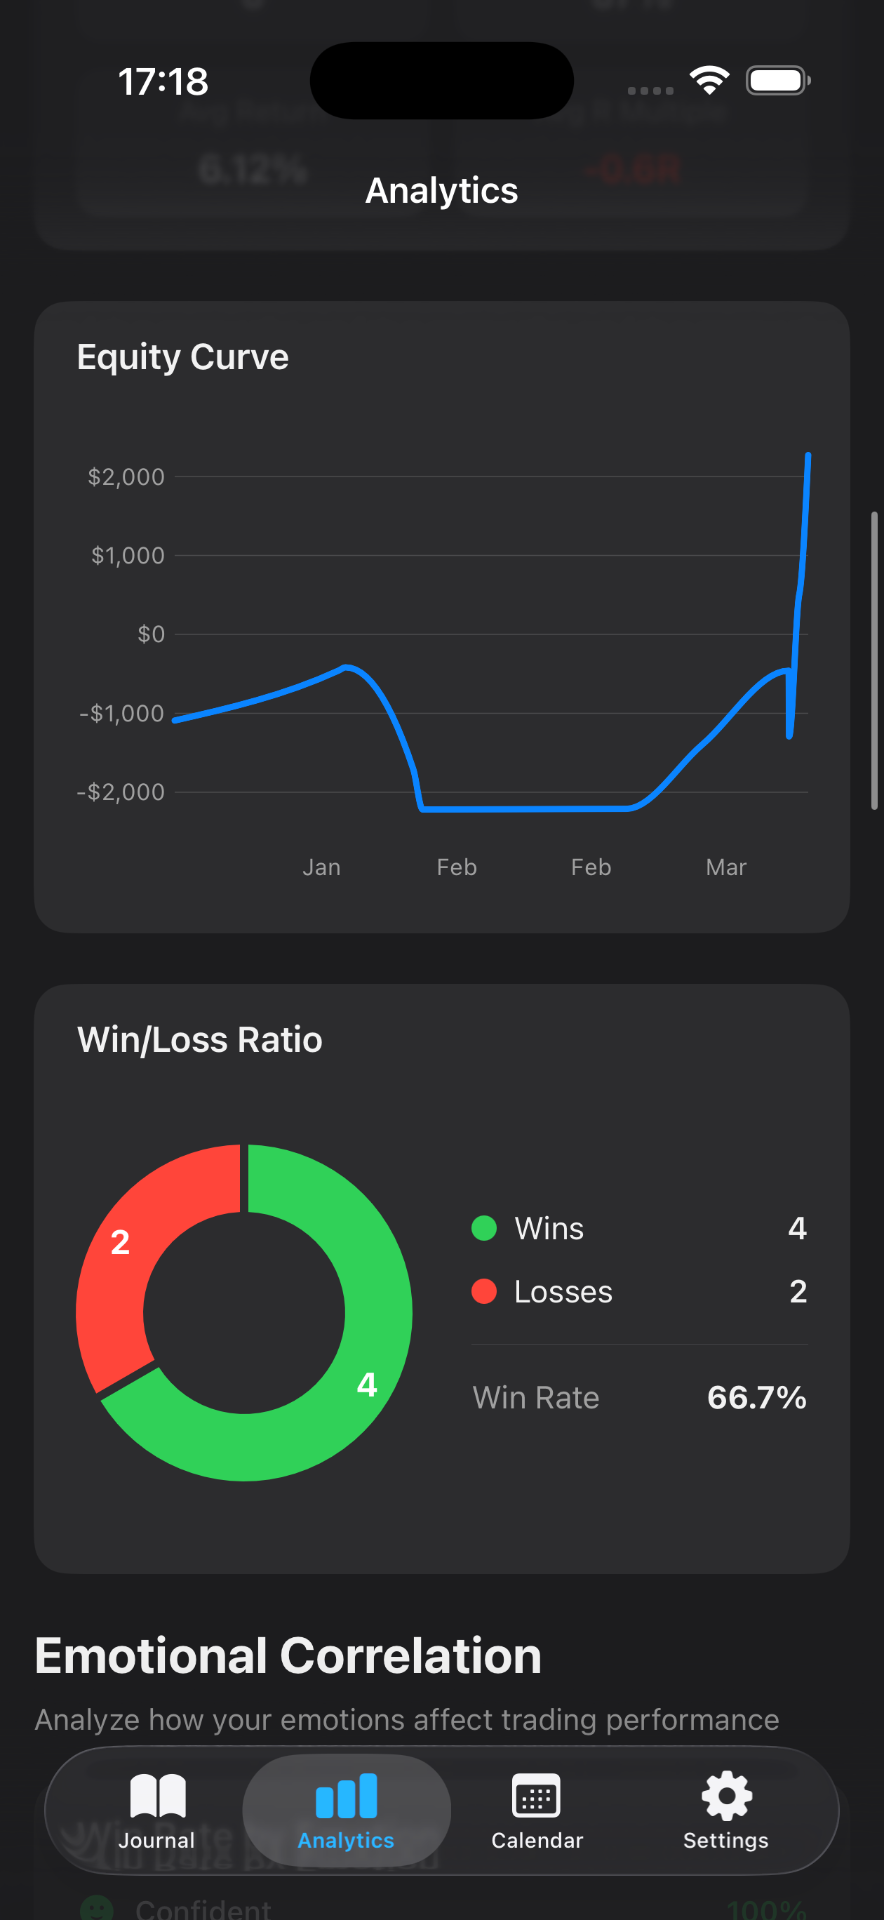
The equity curve groups same-day exits. Close two positions on Wednesday and Wednesday moves once, by the sum.
Say you sell half of an AAPL position on Tuesday and the rest on Wednesday. Tuesday's square is only the half you closed. Wednesday gets the rest. Shares still open do not land on the calendar. They show as unrealized P/L on the position, with live prices. You will also see that realized figure written as PnL.
Opens the App Store
From calendar to weekly review
The weekly report reads the same closes. It shows realized P/L, win rate, the best and worst days, and the daily P/L trend. On the free tier you see the current week. Historical weeks are Premium.
Win rate there is the share of closed trades that made money. How to track win rate walks through the calculation.
When Tuesday is red and you want the reason, open the trades and read the emotion tag you put on the position. You chose that label. Mantis does not assign it. The trading psychology page covers the tag, and how it sits next to the result.
Getting trades in: manual, CSV or IBKR
You can log a trade by hand in ~30 seconds. Mantis is free for 10 trades a month.
CSV import is Premium. It auto-detects only four formats: a Mantis native export, TraderSync, Tradervue, and an Interactive Brokers Activity Statement. The IB statement covers stocks and forex only. Options, futures, and bonds are skipped. There is no generic parser and no column mapping.
Interactive Brokers can also come in through a Flex Query. You choose since the last sync, the last 7 days, or a custom range. Duplicate fills are skipped. That Flex import is separate from the Activity Statement. There is no automatic sync for any other broker. If the broker is not IBKR, you type the trade, or you import a TraderSync, Tradervue, or Mantis file.
Spreadsheet P&L calendar vs an app
A spreadsheet is free, and you can lay the grid out however you want. You also maintain the formulas, and you enter the trade a second time after the broker already has it. One bad paste and a day total is wrong, with no warning.
A spreadsheet profit tracker can show the same day, if you keep the formulas alive. The app fills the square from the trade log you already keep. You do not repair a SUM that drifted. A hand-kept trading calendar means typing the day again. The spreadsheet alternative is the longer comparison.
What Mantis doesn't do
Mantis runs on iPhone and needs iOS 18 or later. There is no Android app and no web app. There are no iPad- or Mac-specific features.
There is no account. The journal stays on the device. There is no cloud sync or backup.
There is no paper-trading mode, and no flag that marks a trade as simulated or live. Mantis will not simulate a fill.
It will not tell you what to buy or sell. There are no signals and no trade ideas. The record is yours to read. It is not advice.
If you are choosing an iPhone journal, the iPhone journal comparison puts Mantis next to the other apps. Profit factor and max drawdown each have a short definition. The trading journals hub holds the rest of the library. Read what a trading journal is if you want the definition first. If you are flat by the close, the day trading journal matches that session.
FAQ
Is there a free P&L calendar app?
Mantis is free for 10 trades a month. Basic analytics are included. Free shows this month's calendar; Premium unlocks past months. Premium is $4.99 a month or $29.99 a year in the US, and prices vary by region. Historical weeks of the weekly report are Premium. CSV import is Premium too.
Can I import trades to fill the calendar?
On Premium, CSV import auto-detects only four formats: a Mantis native export, TraderSync, Tradervue, and an Interactive Brokers Activity Statement. The IB statement covers stocks and forex only. Options, futures, and bonds are skipped. There is no generic parser and no column mapping. IBKR Flex Query import is separate, with duplicate detection and a date range you choose.
Does it work for options, futures, forex and crypto?
You log the trade yourself, so the same calendar covers stocks, ETFs, options, futures, forex, and crypto. Mantis does not connect to those markets for you, except through an IBKR Flex import.
Does Mantis show unrealized P/L?
Open positions show unrealized P/L with live prices. You may also see that number written as PnL. The calendar leaves it off the grid and uses realized P/L from trades you have closed.
Important: Mantis is a trading journal and analytics tool. This page is not investment advice, not financial advice, and not a recommendation to buy or sell any security or instrument. Trading involves risk; past performance does not guarantee future results. Consult a qualified professional before making financial decisions.